Aircraft Seat Width Engineers want to design seats in commercial aircraft so that they are wide enough to fit 99% of all adults. (Accommodating 100% of adults would require very wide seats that would be much too expensive.) Assume adults have hip widths that are normally distributed with a mean of 14.3 in. and a standard deviation of 0.9 in. (based on data from Applied Ergonomics). Find P99. That is, find the hip width for adults that separates the smallest 99% from the largest 1%.
Table of contents
- 1. Intro to Stats and Collecting Data1h 14m
- 2. Describing Data with Tables and Graphs1h 56m
- 3. Describing Data Numerically2h 5m
- 4. Probability2h 16m
- 5. Binomial Distribution & Discrete Random Variables3h 6m
- 6. Normal Distribution and Continuous Random Variables2h 11m
- 7. Sampling Distributions & Confidence Intervals: Mean3h 23m
- Sampling Distribution of the Sample Mean and Central Limit Theorem19m
- Distribution of Sample Mean - Excel23m
- Introduction to Confidence Intervals15m
- Confidence Intervals for Population Mean1h 18m
- Determining the Minimum Sample Size Required12m
- Finding Probabilities and T Critical Values - Excel28m
- Confidence Intervals for Population Means - Excel25m
- 8. Sampling Distributions & Confidence Intervals: Proportion2h 10m
- 9. Hypothesis Testing for One Sample5h 8m
- Steps in Hypothesis Testing1h 6m
- Performing Hypothesis Tests: Means1h 4m
- Hypothesis Testing: Means - Excel42m
- Performing Hypothesis Tests: Proportions37m
- Hypothesis Testing: Proportions - Excel27m
- Performing Hypothesis Tests: Variance12m
- Critical Values and Rejection Regions28m
- Link Between Confidence Intervals and Hypothesis Testing12m
- Type I & Type II Errors16m
- 10. Hypothesis Testing for Two Samples5h 37m
- Two Proportions1h 13m
- Two Proportions Hypothesis Test - Excel28m
- Two Means - Unknown, Unequal Variance1h 3m
- Two Means - Unknown Variances Hypothesis Test - Excel12m
- Two Means - Unknown, Equal Variance15m
- Two Means - Unknown, Equal Variances Hypothesis Test - Excel9m
- Two Means - Known Variance12m
- Two Means - Sigma Known Hypothesis Test - Excel21m
- Two Means - Matched Pairs (Dependent Samples)42m
- Matched Pairs Hypothesis Test - Excel12m
- Two Variances and F Distribution29m
- Two Variances - Graphing Calculator16m
- 11. Correlation1h 24m
- 12. Regression3h 33m
- Linear Regression & Least Squares Method26m
- Residuals12m
- Coefficient of Determination12m
- Regression Line Equation and Coefficient of Determination - Excel8m
- Finding Residuals and Creating Residual Plots - Excel11m
- Inferences for Slope31m
- Enabling Data Analysis Toolpak1m
- Regression Readout of the Data Analysis Toolpak - Excel21m
- Prediction Intervals13m
- Prediction Intervals - Excel19m
- Multiple Regression - Excel29m
- Quadratic Regression15m
- Quadratic Regression - Excel10m
- 13. Chi-Square Tests & Goodness of Fit2h 21m
- 14. ANOVA2h 28m
6. Normal Distribution and Continuous Random Variables
Standard Normal Distribution
Problem 2.2.19a
Textbook Question
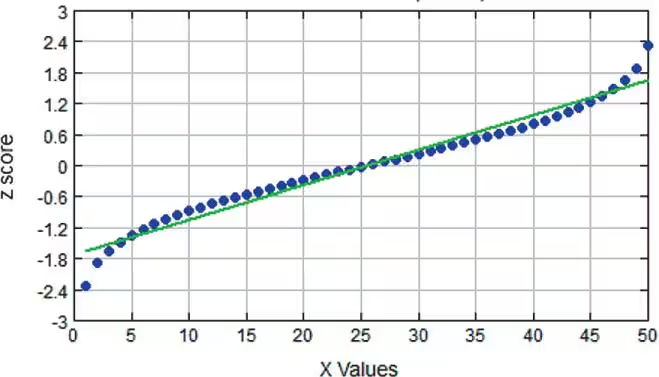
Interpreting Normal Quantile Plots Which of the following normal quantile plots appear to represent data from a population having a normal distribution? Explain.
a. 
 Verified step by step guidance
1
Observe the normal quantile plot provided. A normal quantile plot compares the quantiles of the data to the quantiles of a standard normal distribution. If the data is normally distributed, the points should approximately follow a straight line.
Examine the alignment of the data points (blue dots) with the reference line (green line). If the points closely follow the line without significant deviations, the data is likely from a normal distribution.
Check for systematic patterns or curvature in the plot. For example, if the points deviate significantly at the tails (ends of the plot), this could indicate skewness or heavy tails, suggesting the data is not normally distributed.
In the given plot, the points closely follow the green reference line with only minor deviations at the extremes. This suggests that the data is approximately normally distributed.
Conclude that the normal quantile plot appears to represent data from a population having a normal distribution, as the points align well with the reference line, indicating normality.
 Verified video answer for a similar problem:
This video solution was recommended by our tutors as helpful for the problem above
Video duration:
1mPlay a video:
0 Comments
Key Concepts
Here are the essential concepts you must grasp in order to answer the question correctly.
Normal Distribution
A normal distribution is a continuous probability distribution characterized by its bell-shaped curve, defined by its mean and standard deviation. In a normal distribution, data points are symmetrically distributed around the mean, with most observations clustering near the center and fewer observations appearing as you move away from the mean. Understanding this concept is crucial for interpreting normal quantile plots, as deviations from this shape indicate non-normality.
Recommended video:
Guided course

Finding Standard Normal Probabilities using z-Table
Quantile Plot
A quantile plot, specifically a normal quantile plot, is a graphical tool used to assess if a dataset follows a normal distribution. It plots the quantiles of the dataset against the quantiles of a standard normal distribution. If the points in the plot closely follow a straight line, it suggests that the data is normally distributed; deviations from this line indicate departures from normality.
Recommended video:

Creating Dotplots
Z-scores
Z-scores are standardized scores that indicate how many standard deviations an element is from the mean of the dataset. In the context of normal quantile plots, z-scores are used to transform the data points so that they can be compared to the standard normal distribution. This transformation is essential for determining how well the data fits a normal distribution, as it allows for a direct comparison of the data's distribution to the theoretical normal distribution.
Recommended video:
Guided course

Z-Scores From Given Probability - TI-84 (CE) Calculator

 9:47m
9:47mWatch next
Master Finding Standard Normal Probabilities using z-Table with a bite sized video explanation from Patrick
Start learningRelated Videos
Related Practice
Textbook Question
