Here are the essential concepts you must grasp in order to answer the question correctly.
Poisson Distribution
The Poisson distribution is a probability distribution that expresses the probability of a given number of events occurring in a fixed interval of time or space, given a known average rate of occurrence. It is particularly useful for modeling rare events, such as the number of immigrants arriving in an hour. The formula for the Poisson probability mass function is P(X=k) = (λ^k * e^(-λ)) / k!, where λ is the average rate, k is the number of occurrences, and e is Euler's number.
Recommended video:
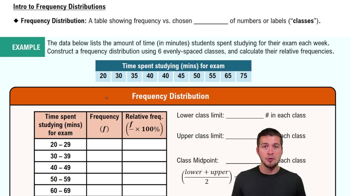
Intro to Frequency Distributions
Mean and Expected Value
The mean, or expected value, of a probability distribution is a measure of the central tendency, representing the average outcome if an experiment were repeated many times. In the context of the Poisson distribution, the mean (λ) indicates the average number of events (e.g., immigrants) expected in a given time frame. Understanding the mean helps in calculating probabilities for specific outcomes, such as zero, five, or eight immigrants in an hour.
Recommended video:
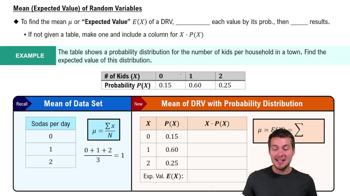
Expected Value (Mean) of Random Variables
Unusual Events
In statistics, an event is often considered unusual if its probability is significantly low, typically below 5%. This threshold helps in identifying outcomes that deviate from what is expected under a given distribution. When analyzing the probabilities of immigration numbers, determining whether the events of zero, five, or eight immigrants are unusual involves comparing their calculated probabilities to this benchmark, providing insight into the likelihood of these occurrences.
Recommended video:
Probability of Multiple Independent Events