Finding Sample Statistics In Exercises 15 and 16, find the range, mean, variance, and standard deviation of the sample data set.
Pregnancy Durations The durations (in days) of pregnancies for a random sample of pregnant people 277 291 295 280 268 278 291 277 282 279 296 285 269 293 267 281 286 269 264 299 275
Verified step by step guidance
1
Step 1: Organize the data set in ascending order to make it easier to calculate the range and other statistics. The data set is: 264, 267, 268, 269, 269, 275, 277, 277, 278, 279, 280, 281, 282, 285, 286, 291, 291, 293, 295, 296, 299.
Step 2: Calculate the range by subtracting the smallest value (264) from the largest value (299). The formula for range is: .
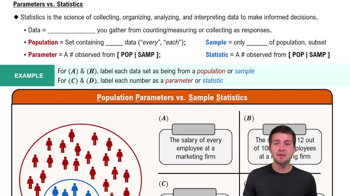
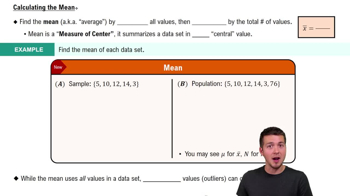
Step 3: Calculate the mean (average) by summing all the data points and dividing by the total number of data points. The formula for mean is: , where is the sum of all data points and is the number of data points.
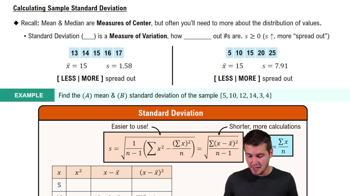
Step 4: Calculate the variance. First, find the squared differences between each data point and the mean, then sum these squared differences, and finally divide by (since this is a sample). The formula for variance is: .
Step 5: Calculate the standard deviation by taking the square root of the variance. The formula for standard deviation is: .
Verified video answer for a similar problem:
This video solution was recommended by our tutors as helpful for the problem above
Video duration:
8m
Play a video:
Was this helpful?
Key Concepts
Here are the essential concepts you must grasp in order to answer the question correctly.
Descriptive Statistics
Descriptive statistics summarize and describe the main features of a data set. Key measures include the mean (average), variance (measure of data spread), standard deviation (average distance from the mean), and range (difference between the maximum and minimum values). These statistics provide a quick overview of the data's central tendency and variability.
The mean is the average of a data set, calculated by summing all values and dividing by the number of observations. It is a measure of central tendency that provides insight into the overall level of the data. However, it can be sensitive to outliers, which may skew the result.
Variance measures how far each number in the data set is from the mean, providing an indication of data spread. Standard deviation, the square root of variance, expresses this spread in the same units as the data, making it easier to interpret. Both are crucial for understanding the distribution and consistency of the data.