

 06:33
06:33


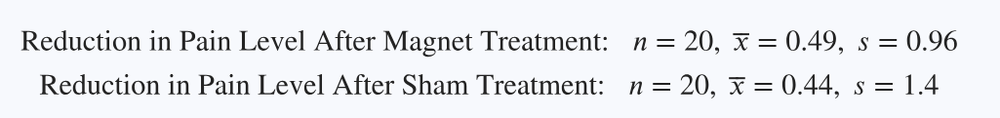
In Exercises 5–20, assume that the two samples are independent simple random samples selected from normally distributed populations, and do not assume that the population standard deviations are equal. (Note: Answers in Appendix D include technology answers based on Formula 9-1 along with “Table” answers based on Table A-3 with df equal to the smaller of n1-1 and n2-1)
Queues Listed on the next page are waiting times (seconds) of observed cars at a Delaware inspection station. The data from two waiting lines are real observations, and the data from the single waiting line are modeled from those real observations. These data are from Data Set 30 “Queues” in Appendix B. The data were collected by the author.
a. Use a 0.01 significance level to test the claim that cars in two queues have a mean waiting time equal to that of cars in a single queue.