
 06:36
06:36


Textbook Question
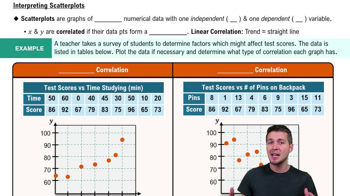
Finding the Equation of the Regression Line
In Exercises 9 and 10, use the given data to find the equation of the regression line. Examine the scatterplot and identify a characteristic of the data that is ignored by the regression line.
[IMAGE]
1
views