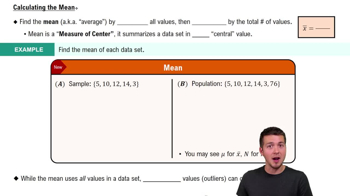
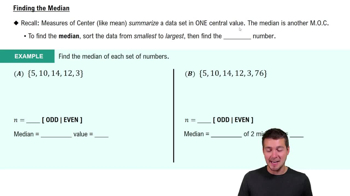
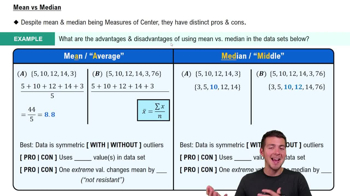
Resistant Measures Listed below are 10 wait times (minutes) for “Rock ‘n’ Roller Coaster” at 10 AM (from Data Set 33 “Disney World Wait Times”). The data are listed in order from lowest to highest. Find the mean and median of these ten values. Then find the mean and median after excluding the value of 180, which appears to be an outlier. Compare the two sets of results. How much was the mean affected by the inclusion of the outlier? How much is the median affected by the inclusion of the outlier?
15 20 25 30 30 35 45 50 50 180


