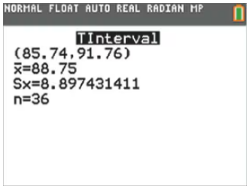
Degrees of Freedom In general, what does “degrees of freedom” refer to? For the sample data described in Exercise 7 “Requirements,” find the number of degrees of freedom, assuming that you want to construct a confidence interval estimate of u using the t distribution.
Table of contents
- 1. Intro to Stats and Collecting Data55m
- 2. Describing Data with Tables and Graphs1h 55m
- 3. Describing Data Numerically1h 45m
- 4. Probability2h 16m
- 5. Binomial Distribution & Discrete Random Variables2h 33m
- 6. Normal Distribution and Continuous Random Variables1h 38m
- 7. Sampling Distributions & Confidence Intervals: Mean1h 53m
- 8. Sampling Distributions & Confidence Intervals: Proportion1h 12m
- 9. Hypothesis Testing for One Sample2h 19m
- 10. Hypothesis Testing for Two Samples3h 22m
- 11. Correlation1h 6m
- 12. Regression1h 4m
- 13. Chi-Square Tests & Goodness of Fit1h 20m
- 14. ANOVA1h 0m
7. Sampling Distributions & Confidence Intervals: Mean
Confidence Intervals for Population Mean
Problem 2b
Textbook Question
In Exercises 1–4, refer to the accompanying screen display that results from a simple random sample of times (minutes) between eruptions of the Old Faithful geyser. The confidence level of 95% was used.

Degrees of Freedom
b. Find the critical value ta/2 corresponding to a 95% confidence level.

1
Step 1: Understand the problem. You are tasked with finding the critical value tα/2 corresponding to a 95% confidence level. This value is used in constructing confidence intervals when the sample size is small and the population standard deviation is unknown.
Step 2: Identify the degrees of freedom (df). The degrees of freedom for a t-distribution are calculated as df = n - 1, where n is the sample size. From the image, n = 36, so df = 36 - 1 = 35.
Step 3: Recognize the significance level (α). For a 95% confidence level, α = 1 - 0.95 = 0.05. Since the critical value tα/2 splits the remaining 5% equally in the two tails of the t-distribution, the area in each tail is α/2 = 0.05/2 = 0.025.
Step 4: Use a t-distribution table or statistical software to find the critical value tα/2. Look up the value corresponding to df = 35 and a tail probability of 0.025. Alternatively, use a calculator or software to compute this value.
Step 5: Interpret the critical value. The critical value tα/2 is the point on the t-distribution where the area to the right of it in the upper tail is 0.025. This value is used to calculate the margin of error in the confidence interval.

This video solution was recommended by our tutors as helpful for the problem above
Video duration:
2mPlay a video:
Was this helpful?
Key Concepts
Here are the essential concepts you must grasp in order to answer the question correctly.
Confidence Interval
A confidence interval is a range of values, derived from sample statistics, that is likely to contain the true population parameter. It is expressed with a certain confidence level, such as 95%, indicating the probability that the interval will capture the true parameter if the same sampling method is repeated multiple times.
Recommended video:
Introduction to Confidence Intervals
Critical Value (tα/2)
The critical value tα/2 is a point on the t-distribution that corresponds to the desired confidence level. For a 95% confidence level, it represents the value that separates the most extreme 2.5% of the distribution on each tail, which is used to calculate the margin of error in constructing the confidence interval.
Recommended video:
Critical Values: t-Distribution
Degrees of Freedom
Degrees of freedom (df) refer to the number of independent values that can vary in a statistical calculation. In the context of t-distributions, it is typically calculated as n - 1, where n is the sample size. This concept is crucial for determining the appropriate critical value from the t-distribution table.
Recommended video:
Critical Values: t-Distribution
Watch next
Master Population Standard Deviation Known with a bite sized video explanation from Patrick
Start learningRelated Videos
Related Practice
Textbook Question