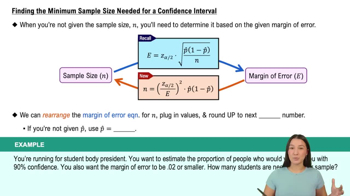
Heights of Presidents Refer to Data Set 22 “Presidents” in Appendix B. Treat the data as a sample and find the proportion of presidents who were taller than their opponents. Use that result to construct a 95% confidence interval estimate of the population percentage. Based on the result, does it appear that greater height is an advantage for presidential candidates? Why or why not?
Table of contents
- 1. Intro to Stats and Collecting Data55m
- 2. Describing Data with Tables and Graphs1h 55m
- 3. Describing Data Numerically1h 45m
- 4. Probability2h 16m
- 5. Binomial Distribution & Discrete Random Variables2h 33m
- 6. Normal Distribution and Continuous Random Variables1h 38m
- 7. Sampling Distributions & Confidence Intervals: Mean1h 53m
- 8. Sampling Distributions & Confidence Intervals: Proportion1h 12m
- 9. Hypothesis Testing for One Sample2h 19m
- 10. Hypothesis Testing for Two Samples3h 22m
- 11. Correlation1h 6m
- 12. Regression1h 4m
- 13. Chi-Square Tests & Goodness of Fit1h 20m
- 14. ANOVA1h 0m
8. Sampling Distributions & Confidence Intervals: Proportion
Confidence Intervals for Population Proportion
Problem 7.1.33c
Textbook Question
E-Cigarettes A New York Times article reported that a survey conducted in 2014 included 36,000 adults, with 3.7% of them being regular users of e-cigarettes. Because e-cigarette use is relatively new, there is a need to obtain today’s usage rate. How many adults must be surveyed now if we want a confidence level of 95% and a margin of error of 1.5 percentage points?
c. Does the use of the result from the 2014 survey have much of an effect on the sample size?

1
Step 1: Understand the problem. We are tasked with determining the sample size required to estimate the proportion of adults who are regular users of e-cigarettes with a 95% confidence level and a margin of error of 1.5 percentage points. Additionally, we need to consider whether the 2014 survey result (3.7%) affects the sample size calculation.
Step 2: Recall the formula for sample size calculation for proportions: \( n = \frac{{Z^2 \cdot p \cdot (1-p)}}{{E^2}} \), where \( Z \) is the z-score corresponding to the confidence level, \( p \) is the estimated proportion, and \( E \) is the margin of error.
Step 3: Identify the values needed for the formula. For a 95% confidence level, the z-score \( Z \) is approximately 1.96. The margin of error \( E \) is given as 1.5 percentage points, which should be converted to a decimal (0.015). The proportion \( p \) can be taken from the 2014 survey result (3.7%, or 0.037), but we should also consider the worst-case scenario where \( p \) is 0.5 (maximum variability).
Step 4: Calculate the sample size using both \( p = 0.037 \) and \( p = 0.5 \). Substitute the values into the formula \( n = \frac{{Z^2 \cdot p \cdot (1-p)}}{{E^2}} \). Perform the calculation for each case to see how the choice of \( p \) affects the sample size.
Step 5: Compare the results. Discuss whether using the 2014 survey proportion (3.7%) significantly reduces the sample size compared to using \( p = 0.5 \). This will help determine if the prior survey data has a substantial effect on the sample size calculation.

This video solution was recommended by our tutors as helpful for the problem above
Video duration:
3mPlay a video:
Was this helpful?
Key Concepts
Here are the essential concepts you must grasp in order to answer the question correctly.
Sample Size Calculation
Sample size calculation is a statistical method used to determine the number of observations or replicates needed in a study to achieve a desired level of precision. It takes into account the population size, the expected proportion of the attribute of interest, the desired confidence level, and the margin of error. In this case, the calculation will help determine how many adults need to be surveyed to estimate the current e-cigarette usage rate accurately.
Recommended video:
Sampling Distribution of Sample Proportion
Confidence Level
The confidence level represents the degree of certainty that the true population parameter lies within the confidence interval calculated from the sample data. A 95% confidence level means that if the same survey were conducted multiple times, approximately 95% of the calculated intervals would contain the true population proportion. This concept is crucial for understanding the reliability of the survey results.
Recommended video:
Introduction to Confidence Intervals
Margin of Error
The margin of error quantifies the amount of random sampling error in a survey's results. It indicates the range within which the true population parameter is expected to fall, based on the sample data. A smaller margin of error requires a larger sample size, which is important for ensuring that the survey results are precise and reflect the current usage rate of e-cigarettes accurately.
Recommended video:
Finding the Minimum Sample Size Needed for a Confidence Interval
Watch next
Master Constructing Confidence Intervals for Proportions with a bite sized video explanation from Patrick
Start learningRelated Videos
Related Practice
Textbook Question