12. Regression
Residuals
Struggling with Statistics?
Join thousands of students who trust us to help them ace their exams!Watch the first videoMultiple Choice
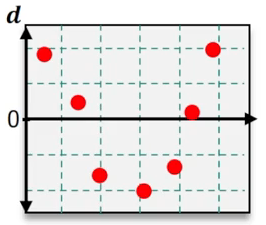
Which of the following residual plots suggest that a linear regression model is appropriate?
A
B

C

D

 Verified step by step guidance
1
Step 1: Understand the purpose of residual plots. Residual plots are used to assess the appropriateness of a linear regression model. A good residual plot for linear regression should show no discernible pattern, with residuals randomly scattered around zero.
Step 2: Analyze the first residual plot. Check if the residuals are randomly scattered around the horizontal axis (zero line) without forming any systematic pattern.
Step 3: Analyze the second residual plot. Look for any trends or systematic patterns, such as a curve or increasing/decreasing residuals, which would indicate that a linear model is not appropriate.
Step 4: Analyze the third residual plot. Again, check for randomness in the distribution of residuals around the zero line. If the residuals are evenly scattered, this suggests a linear model may be appropriate.
Step 5: Analyze the fourth residual plot. Look for any systematic patterns, such as clusters or trends, which would suggest that a linear model is not suitable. Random scatter indicates appropriateness for linear regression.

 7:38m
7:38mWatch next
Master Residuals and Residual Plots with a bite sized video explanation from Patrick
Start learningRelated Videos
0

