Here are the essential concepts you must grasp in order to answer the question correctly.
Probability Distribution
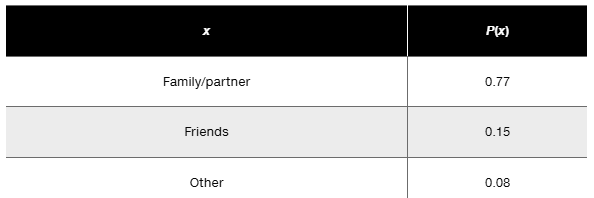
A probability distribution describes how the probabilities of a random variable are distributed across its possible values. For a valid probability distribution, the sum of all probabilities must equal 1, and each individual probability must be between 0 and 1. In the context of the survey, the table lists the probabilities associated with different contributors to happiness.
Recommended video:
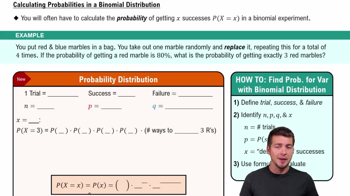
Calculating Probabilities in a Binomial Distribution
Total Probability
Total probability refers to the sum of all probabilities in a probability distribution. It is a crucial aspect to verify if a set of probabilities forms a valid distribution. In the given table, the total probability is calculated by adding the probabilities of Family/partner (0.77), Friends (0.15), and Other (0.08), which equals 1.00, confirming that it meets the criteria for a probability distribution.
Recommended video:
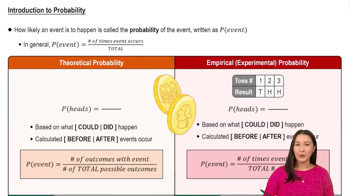
Introduction to Probability
Random Variable
A random variable is a variable whose possible values are numerical outcomes of a random phenomenon. In this case, the random variable represents different contributors to happiness, such as Family/partner, Friends, and Other. Each contributor has an associated probability, indicating the likelihood of it being a significant factor in the respondents' happiness.
Recommended video:
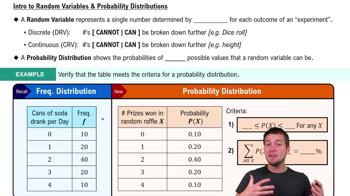
Intro to Random Variables & Probability Distributions