2. Determine whether each number could represent the probability of an event. Explain your reasoning. a. 25/25
Table of contents
- 1. Intro to Stats and Collecting Data1h 14m
- 2. Describing Data with Tables and Graphs1h 56m
- 3. Describing Data Numerically2h 5m
- 4. Probability2h 16m
- 5. Binomial Distribution & Discrete Random Variables3h 6m
- 6. Normal Distribution and Continuous Random Variables2h 11m
- 7. Sampling Distributions & Confidence Intervals: Mean3h 23m
- Sampling Distribution of the Sample Mean and Central Limit Theorem19m
- Distribution of Sample Mean - Excel23m
- Introduction to Confidence Intervals15m
- Confidence Intervals for Population Mean1h 18m
- Determining the Minimum Sample Size Required12m
- Finding Probabilities and T Critical Values - Excel28m
- Confidence Intervals for Population Means - Excel25m
- 8. Sampling Distributions & Confidence Intervals: Proportion2h 10m
- 9. Hypothesis Testing for One Sample5h 8m
- Steps in Hypothesis Testing1h 6m
- Performing Hypothesis Tests: Means1h 4m
- Hypothesis Testing: Means - Excel42m
- Performing Hypothesis Tests: Proportions37m
- Hypothesis Testing: Proportions - Excel27m
- Performing Hypothesis Tests: Variance12m
- Critical Values and Rejection Regions28m
- Link Between Confidence Intervals and Hypothesis Testing12m
- Type I & Type II Errors16m
- 10. Hypothesis Testing for Two Samples5h 37m
- Two Proportions1h 13m
- Two Proportions Hypothesis Test - Excel28m
- Two Means - Unknown, Unequal Variance1h 3m
- Two Means - Unknown Variances Hypothesis Test - Excel12m
- Two Means - Unknown, Equal Variance15m
- Two Means - Unknown, Equal Variances Hypothesis Test - Excel9m
- Two Means - Known Variance12m
- Two Means - Sigma Known Hypothesis Test - Excel21m
- Two Means - Matched Pairs (Dependent Samples)42m
- Matched Pairs Hypothesis Test - Excel12m
- Two Variances and F Distribution29m
- Two Variances - Graphing Calculator16m
- 11. Correlation1h 24m
- 12. Regression3h 33m
- Linear Regression & Least Squares Method26m
- Residuals12m
- Coefficient of Determination12m
- Regression Line Equation and Coefficient of Determination - Excel8m
- Finding Residuals and Creating Residual Plots - Excel11m
- Inferences for Slope31m
- Enabling Data Analysis Toolpak1m
- Regression Readout of the Data Analysis Toolpak - Excel21m
- Prediction Intervals13m
- Prediction Intervals - Excel19m
- Multiple Regression - Excel29m
- Quadratic Regression15m
- Quadratic Regression - Excel10m
- 13. Chi-Square Tests & Goodness of Fit2h 21m
- 14. ANOVA2h 28m
4. Probability
Basic Concepts of Probability
Problem 3.1.3
Textbook Question
3. Explain why the statement is incorrect: The probability of rain is 150%.
 Verified step by step guidance
1
Step 1: Begin by explaining the concept of probability. Probability is a measure of the likelihood of an event occurring, expressed as a number between 0 and 1 (or equivalently, 0% to 100%). A probability of 0 means the event is impossible, while a probability of 1 (or 100%) means the event is certain.
Step 2: Clarify that probabilities cannot exceed 1 (or 100%). This is because probability represents a fraction of the total possible outcomes, and the total probability of all possible outcomes must sum to 1 (or 100%).
Step 3: Discuss why the statement 'The probability of rain is 150%' is incorrect. A probability of 150% exceeds the maximum possible value of 100%, which violates the fundamental definition of probability.
Step 4: Provide an example to reinforce the concept. For instance, if the probability of rain were 50%, it would mean there is a 50/100 chance of rain occurring. A probability of 150% would imply more than certainty, which is not logically or mathematically valid.
Step 5: Conclude by emphasizing that probabilities are always constrained within the range of 0 to 1 (or 0% to 100%), and any value outside this range is not meaningful in the context of probability theory.
 Verified video answer for a similar problem:
This video solution was recommended by our tutors as helpful for the problem above
Video duration:
1mPlay a video:
0 Comments
Key Concepts
Here are the essential concepts you must grasp in order to answer the question correctly.
Probability Range
Probability is a measure of the likelihood of an event occurring, expressed as a number between 0 and 1, or as a percentage from 0% to 100%. A probability of 0% means the event will not happen, while 100% means it is certain to occur. Therefore, stating a probability of 150% exceeds this range and is mathematically invalid.
Recommended video:

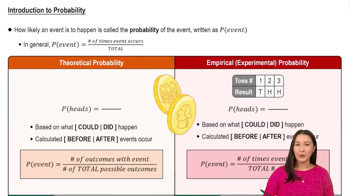
Introduction to Probability
Understanding Percentages
Percentages represent a fraction of 100. When discussing probabilities, they indicate how likely an event is to occur out of 100 possible outcomes. A probability of 150% suggests that the event is more than certain, which is impossible, as it cannot exceed the totality of possible outcomes.
Recommended video:
Guided course

Step 1: Write Hypotheses
Interpretation of Weather Forecasts
Weather forecasts often express the probability of rain as a percentage, indicating the chance of rain occurring in a specific area over a given time. A probability of rain is based on historical data and meteorological models, and it should always fall within the 0% to 100% range to be meaningful and accurate.
Recommended video:

Introduction to Probability

 5:37m
5:37mWatch next
Master Introduction to Probability with a bite sized video explanation from Patrick
Start learningRelated Videos
Related Practice
Textbook Question
