3. Functions
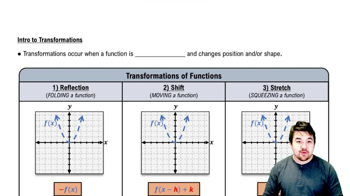
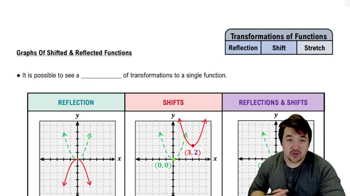
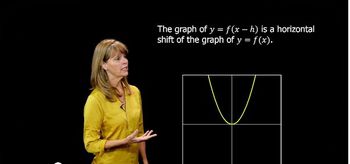
Transformations
3. Functions
Transformations
 5:25
5:25
Showing 9 of 9 videos
Additional 36 creators.
Learn with other creators


Showing 39 of 39 videos
Practice this topic
- Multiple Choice
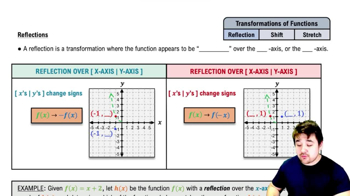
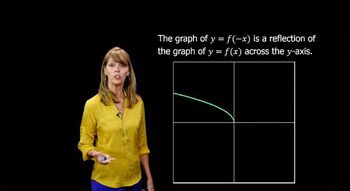
Written below (green dotted curve) is a graph of the function . If g(x) (blue solid curve) is a reflection of f(x) about the y-axis what is the equation for g(x)?
- Multiple Choice
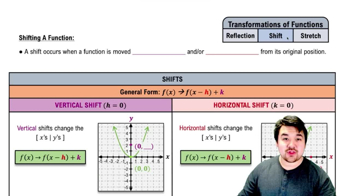
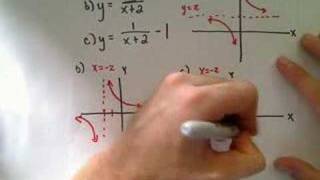
The green dotted line in the graph below represents the function . The blue solid line represents the function , which is the function after it has gone through a shift transformation. Find the equation for .
- Multiple Choice
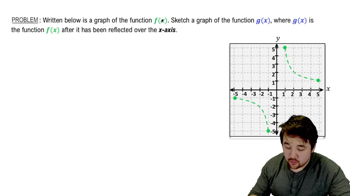
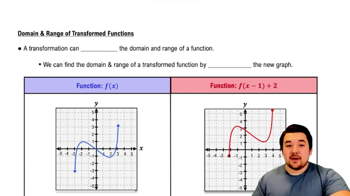
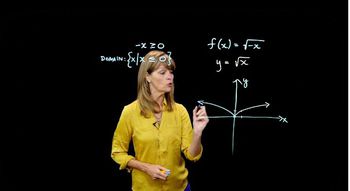
The green dotted curve below is a graph of the function . Find the domain and range of (the blue solid curve), which is a transformation of .
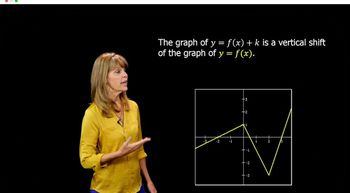
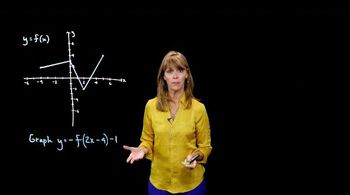
- Open QuestionIn Exercises 1-16, use the graph of y = f(x) to graph each function g. g(x) = f(x)+1
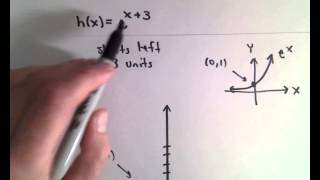
- Open QuestionIn Exercises 1-16, use the graph of y = f(x) to graph each function g. g(x) = f(x+1)
- Open QuestionIn Exercises 1-16, use the graph of y = f(x) to graph each function g. g(x) = f(-x)
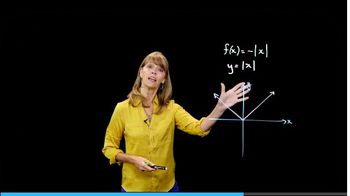
- Open QuestionIn Exercises 1-16, use the graph of y = f(x) to graph each function g. g(x) = -f(x) +3