4. Polynomial Functions
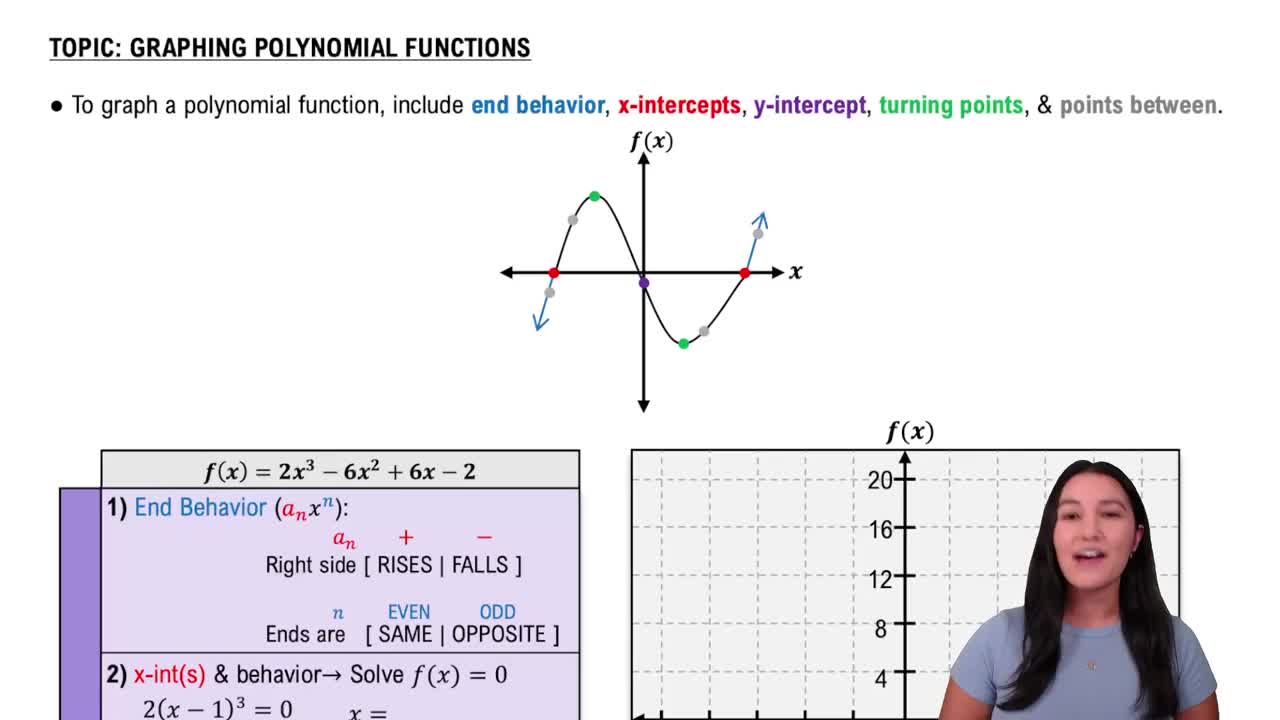
Graphing Polynomial Functions
4. Polynomial Functions
Graphing Polynomial Functions
 05:01
05:01
Additional 2 creators.
Learn with other creators
Practice this topic
- Multiple Choice
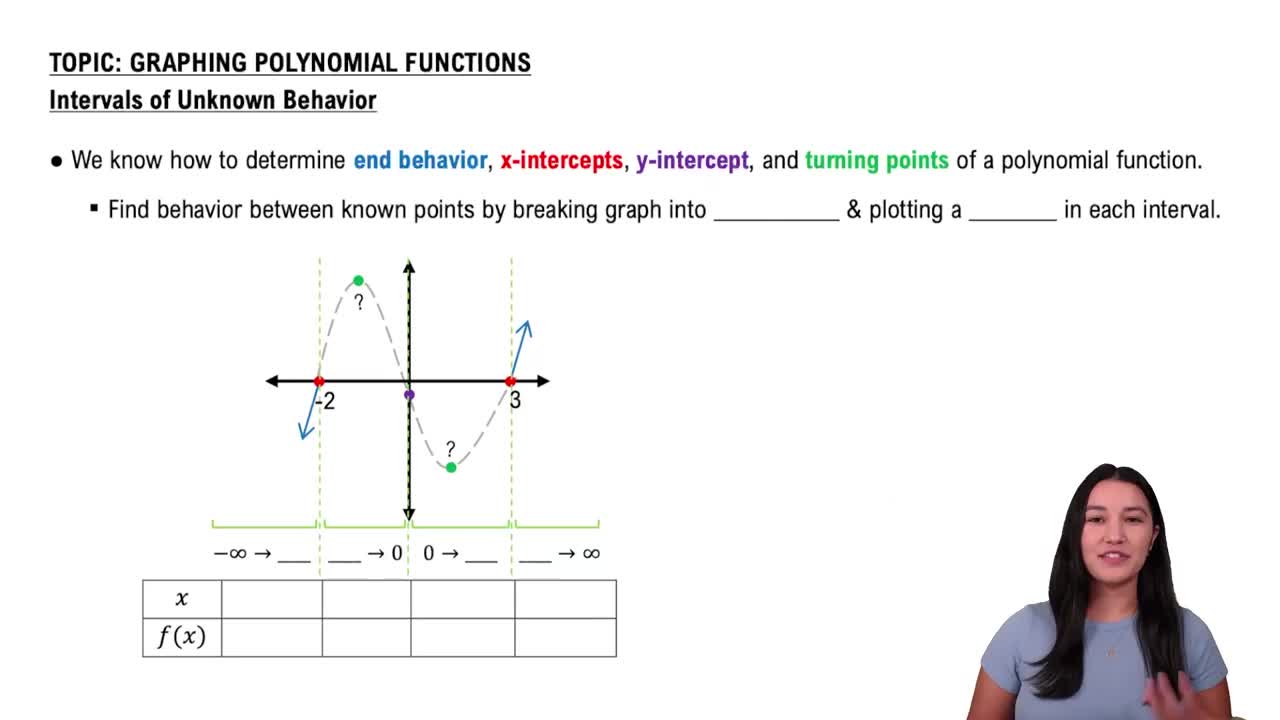
Based on the known points plotted on the graph, determine what intervals the graph should be broken into.
Plotted points are: &
- Multiple Choice
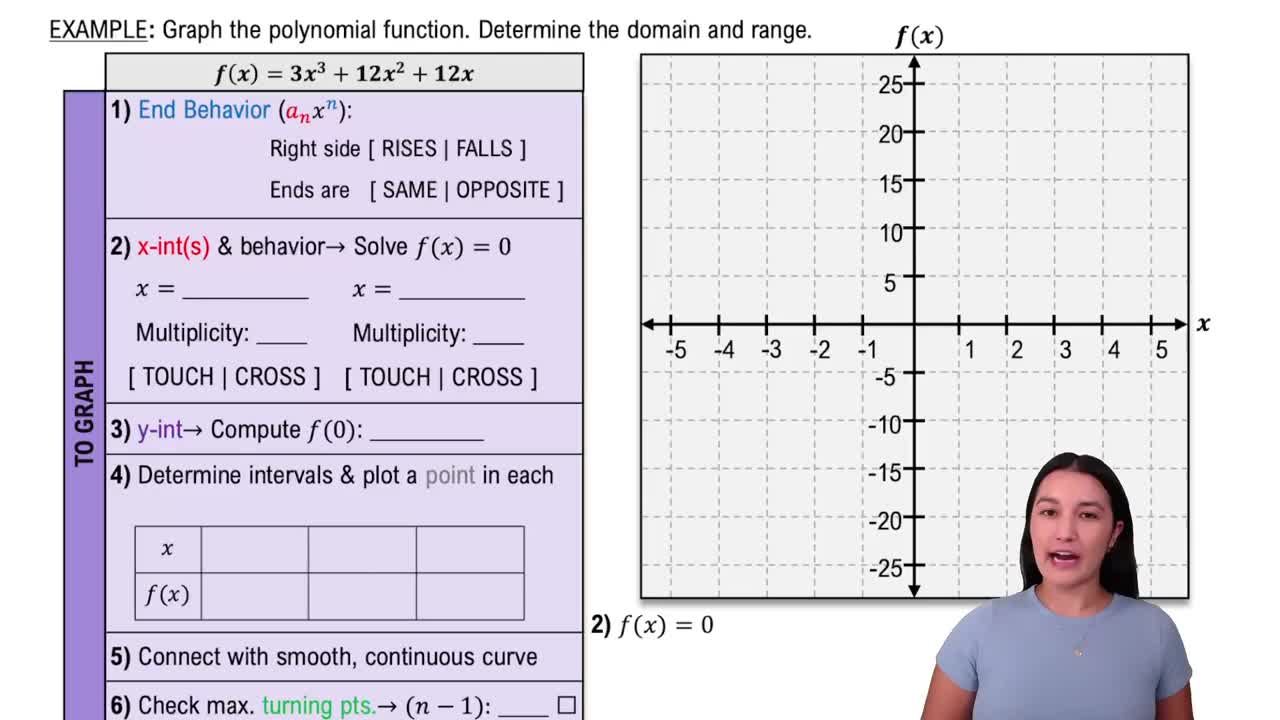
Graph the polynomial function. Determine the domain and range.
- Open QuestionGraph each function. Determine the largest open intervals of the domain over which each function is (a) increasing or (b) decreasing. See Example 1. ƒ(x)=2x^4
- Open QuestionIn Exercises 11–14, identify which graphs are not those of polynomial functions.
- Open QuestionIn Exercises 19–24,(a) Use the Leading Coefficient Test to determine the graph's end behavior.(b) Determine whether the graph has y-axis symmetry, origin symmetry, or neither.(c) Graph the function.f(x) = 4x - x^3
- Open QuestionIn Exercises 33–40, use the Intermediate Value Theorem to show that each polynomial has a real zero between the given integers. f(x)=x^3−4x^2+2; between 0 and 1