Here are the essential concepts you must grasp in order to answer the question correctly.
Graphing Rational Functions
Graphing rational functions involves analyzing the function's behavior by identifying key features such as intercepts, asymptotes, and the overall shape of the graph. For the function y = (x² - 4) / (x² - 2), one must determine where the function is undefined (vertical asymptotes) and where it crosses the axes (x and y intercepts) to sketch an accurate graph.
Recommended video:
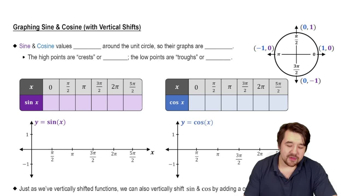
Graph of Sine and Cosine Function
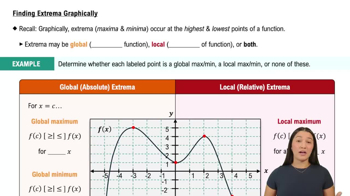
Local and Absolute Extrema
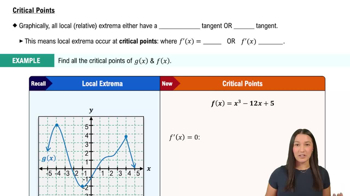
Local extrema refer to points where a function reaches a maximum or minimum value within a specific interval, while absolute extrema are the highest or lowest points over the entire domain of the function. To find these points, one typically uses the first derivative test to identify critical points and the second derivative test to determine their nature.
Recommended video:
Finding Extrema Graphically
Inflection Points
Inflection points occur where the concavity of a function changes, which can be identified by analyzing the second derivative. For the function y = (x² - 4) / (x² - 2), finding inflection points involves determining where the second derivative equals zero or is undefined, indicating a change in the curvature of the graph.
Recommended video: