Here are the essential concepts you must grasp in order to answer the question correctly.
Graphing Rational Functions
Graphing rational functions involves understanding their behavior based on the numerator and denominator. For the function y = 1 / (x² - 1), we identify vertical asymptotes where the denominator is zero, which occurs at x = ±1. Additionally, we analyze the horizontal asymptote, which is determined by the degrees of the numerator and denominator.
Recommended video:
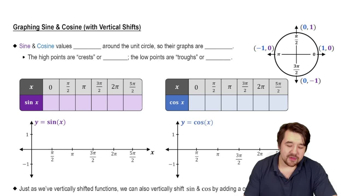
Graph of Sine and Cosine Function
Local Extreme Points
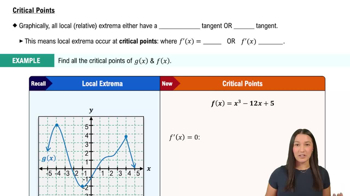
Local extreme points are points on the graph where the function reaches a local maximum or minimum. To find these points, we calculate the first derivative of the function and set it to zero to identify critical points. We then use the first or second derivative test to determine whether these points are maxima, minima, or neither.
Recommended video:
Inflection Points
Inflection points occur where the concavity of the function changes, which can be found by analyzing the second derivative. For the function y = 1 / (x² - 1), we compute the second derivative and set it to zero to find potential inflection points. Evaluating the sign of the second derivative around these points helps confirm whether a change in concavity occurs.
Recommended video: