Here are the essential concepts you must grasp in order to answer the question correctly.
Graphing Functions
Graphing functions involves plotting the curve of a function on a coordinate plane to visualize its behavior. This includes identifying key features such as intercepts, asymptotes, and the overall shape of the graph. For the function y = 1 - (x+1)^3, understanding how transformations affect the graph is crucial, such as shifts and reflections.
Recommended video:
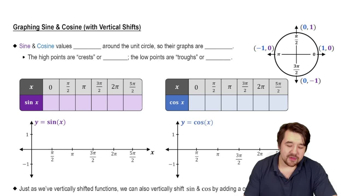
Graph of Sine and Cosine Function
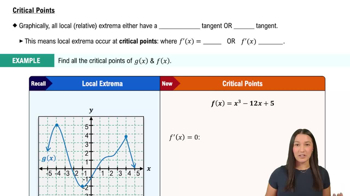
Local Extreme Points
Local extreme points are points where a function reaches a local maximum or minimum within a certain interval. These are found by analyzing the derivative of the function, setting it to zero, and solving for x. For y = 1 - (x+1)^3, finding the derivative will help identify where the slope changes, indicating potential local maxima or minima.
Recommended video:
Inflection Points
Inflection points occur where the curvature of the graph changes, which is determined by the second derivative of the function. An inflection point is where the second derivative equals zero and changes sign. For y = 1 - (x+1)^3, calculating the second derivative will reveal points where the graph transitions from concave up to concave down or vice versa.
Recommended video: