Here are the essential concepts you must grasp in order to answer the question correctly.
Graphing Rational Functions
Graphing rational functions involves understanding the behavior of the function as x approaches certain values, particularly where the denominator equals zero, leading to vertical asymptotes. Additionally, identifying horizontal or oblique asymptotes helps in sketching the overall shape of the graph. Analyzing the function's behavior at these critical points is essential for accurate graphing.
Recommended video:
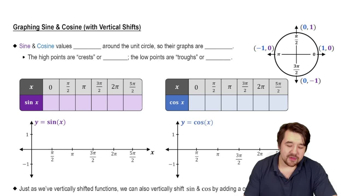
Graph of Sine and Cosine Function
Local and Absolute Extrema
Local extrema refer to points where the function reaches a local maximum or minimum within a certain interval, determined by setting the derivative to zero and analyzing sign changes. Absolute extrema are the highest or lowest points over the entire domain of the function. Identifying these points involves evaluating the function at critical points and endpoints, if applicable.
Recommended video:
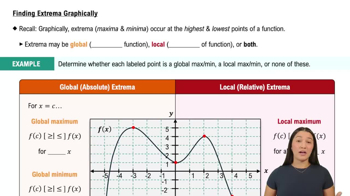
Finding Extrema Graphically
Inflection Points
Inflection points occur where the function's concavity changes, identified by setting the second derivative to zero and confirming a sign change. These points are crucial for understanding the curvature of the graph, as they indicate transitions between concave up and concave down regions. Recognizing inflection points helps in accurately sketching the graph's shape.
Recommended video: