Join thousands of students who trust us to help them ace their exams!Watch the first video
Multiple Choice
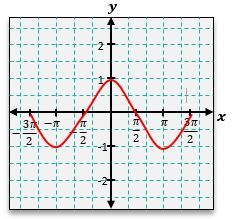
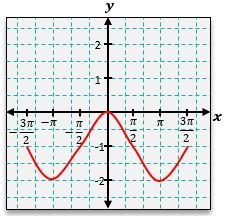
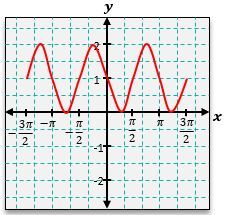
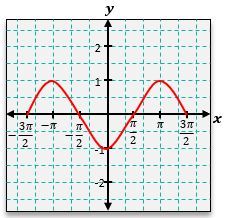
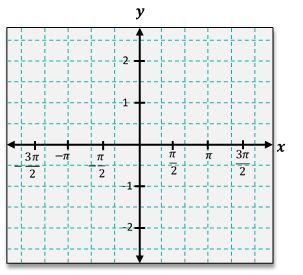
Sketch the function y=cos(x)−1 on the graph below.
A
B
C
D
0 Comments
Verified step by step guidance
1
Start by understanding the function y = \cos(x) - 1. This is a transformation of the basic cosine function y = \cos(x).
The transformation involves a vertical shift downward by 1 unit. This means that every point on the graph of y = \cos(x) will be moved down by 1 unit.
Recall that the cosine function y = \cos(x) has a maximum value of 1 and a minimum value of -1. With the transformation y = \cos(x) - 1, the maximum value becomes 0 and the minimum value becomes -2.
The period of the cosine function is 2\pi, meaning it repeats every 2\pi units along the x-axis. This property remains unchanged in the transformed function y = \cos(x) - 1.
Sketch the graph by plotting key points: at x = 0, y = \cos(0) - 1 = 0; at x = \pi/2, y = \cos(\pi/2) - 1 = -1; at x = \pi, y = \cos(\pi) - 1 = -2; and continue this pattern to complete the graph over the interval shown.
 Verified step by step guidance
 5:53m
5:53m
