Understanding the sine and cosine functions is essential in trigonometry, especially when it comes to graphing these functions on a standard x-y coordinate system. The sine function corresponds to the y-coordinates of points on the unit circle, while the cosine function relates to the x-coordinates. As you traverse the unit circle, the values of sine and cosine repeat, leading to a periodic wave-like behavior in their graphs.
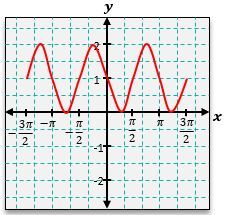
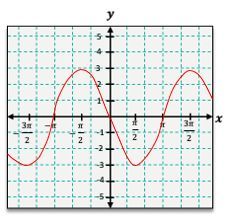
To graph the sine function, denoted as \( y = \sin(x) \), you can start by plotting key points based on the unit circle. For instance, at \( x = 0 \), \( \sin(0) = 0 \); at \( x = \frac{\pi}{2} \), \( \sin\left(\frac{\pi}{2}\right) = 1 \); at \( x = \pi \), \( \sin(\pi) = 0 \); at \( x = \frac{3\pi}{2} \), \( \sin\left(\frac{3\pi}{2}\right) = -1 \); and at \( x = 2\pi \), \( \sin(2\pi) = 0 \). Connecting these points reveals a smooth wave pattern that continues indefinitely due to the periodic nature of the sine function.
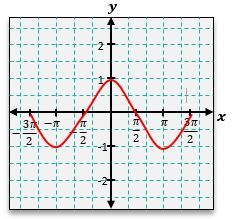
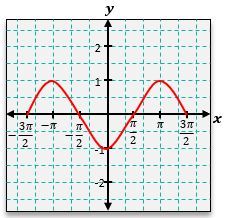
Similarly, the cosine function, represented as \( y = \cos(x) \), can be graphed using its corresponding values. At \( x = 0 \), \( \cos(0) = 1 \); at \( x = \frac{\pi}{2} \), \( \cos\left(\frac{\pi}{2}\right) = 0 \); at \( x = \pi \), \( \cos(\pi) = -1 \); at \( x = \frac{3\pi}{2} \), \( \cos\left(\frac{3\pi}{2}\right) = 0 \); and at \( x = 2\pi \), \( \cos(2\pi) = 1 \). The cosine graph also exhibits a wave pattern, but it starts at a maximum value of 1, contrasting with the sine graph that begins at 0.
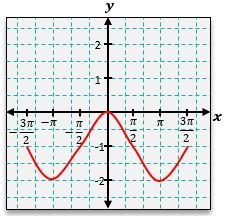
In both graphs, the highest points are referred to as crests or peaks, while the lowest points are known as troughs or valleys. The amplitude of these waves is typically 1 for both sine and cosine functions, but transformations can alter this. One common transformation is a vertical shift, which occurs when a constant \( k \) is added to the function. If \( k \) is positive, the graph shifts upward; if negative, it shifts downward.
For example, to graph the function \( y = \sin(x) + 1 \), you would first graph \( y = \sin(x) \) and then shift the entire graph up by 1 unit. This means the original peaks at 1 become peaks at 2, and the valleys at -1 become valleys at 0. The resulting graph will maintain the wave pattern but will be elevated by one unit.
By mastering these concepts, you can effectively graph sine and cosine functions and understand how transformations affect their shapes and positions on the coordinate plane.