Back
BackProblem 1a
How do we know that threshold traits are actually polygenic even though they may have as few as two discrete phenotypic classes?
Problem 1b
How can we ascertain the number of polygenes involved in the inheritance of a quantitative trait?
Problem 1c
What findings led geneticists to postulate the multiple-factor hypothesis that invoked the idea of additive alleles to explain inheritance patterns?
Problem 1d
How do we assess environmental factors to determine if they impact the phenotype of a quantitatively inherited trait?
Problem 1e
How do we know that monozygotic twins are not identical genotypically as adults?
Problem 2
Write a short essay that discusses the difference between the more traditional Mendelian and neo-Mendelian modes of inheritance (qualitative inheritance) and quantitative inheritance.
Problem 3
Define the following:
(a) Polygenic
(b) Additive alleles
(c) Correlation
(d) Monozygotic and dizygotic twins
(e) Heritability
(f) QTL
(g) Continuous variation
Problem 4a
A dark-red strain and a white strain of wheat are crossed and produce an intermediate, medium-red F₁. When the F₁ plants are interbred, an F₂ generation is produced in a ratio of 1 dark-red: 4 medium-dark-red: 6 medium-red: 4 light-red: 1 white. Further crosses reveal that the dark-red and white F₂ plants are true breeding
Based on the ratios in the F₂ population, how many genes are involved in the production of color?
Problem 4b
A dark-red strain and a white strain of wheat are crossed and produce an intermediate, medium-red F₁. When the F₁ plants are interbred, an F₂ generation is produced in a ratio of 1 dark-red: 4 medium-dark-red: 6 medium-red: 4 light-red: 1 white. Further crosses reveal that the dark-red and white F₂ plants are true breeding
How many additive alleles are needed to produce each possible phenotype?
Problem 4c
A dark-red strain and a white strain of wheat are crossed and produce an intermediate, medium-red F₁. When the F₁ plants are interbred, an F₂ generation is produced in a ratio of 1 dark-red: 4 medium-dark-red: 6 medium-red: 4 light-red: 1 white. Further crosses reveal that the dark-red and white F₂ plants are true breeding
Assign symbols to these alleles, and list possible genotypes that give rise to the medium-red and light-red phenotypes.
Problem 4d
A dark-red strain and a white strain of wheat are crossed and produce an intermediate, medium-red F₁. When the F₁ plants are interbred, an F₂ generation is produced in a ratio of 1 dark-red: 4 medium-dark-red: 6 medium-red: 4 light-red: 1 white. Further crosses reveal that the dark-red and white F₂ plants are true breeding
Predict the outcome of the F1 and F2 generations in a cross between a true-breeding medium-red plant and a white plant.
Problem 5a
Height in humans depends on the additive action of genes. Assume that this trait is controlled by the four loci R, S, T, and U and that environmental effects are negligible. Instead of additive versus nonadditive alleles, assume that additive and partially additive alleles exist. Additive alleles contribute two units, and partially additive alleles contribute one unit to height.
Can two individuals of moderate height produce offspring that are much taller or shorter than either parent? If so, how?
Problem 5b
Height in humans depends on the additive action of genes. Assume that this trait is controlled by the four loci R, S, T, and U and that environmental effects are negligible. Instead of additive versus nonadditive alleles, assume that additive and partially additive alleles exist. Additive alleles contribute two units, and partially additive alleles contribute one unit to height.
If an individual with the minimum height specified by these genes marries an individual of intermediate or moderate height, will any of their children be taller than the tall parent? Why or why not?
Problem 6a
An inbred strain of plants has a mean height of 24 cm. A second strain of the same species from a different geographic region also has a mean height of 24 cm. When plants from the two strains are crossed together, the F₁ plants are the same height as the parent plants. However, the F₂ generation shows a wide range of heights; the majority are like the P₁ and F₁ plants, but approximately 4 of 1000 are only 12 cm high and about 4 of 1000 are 36 cm high.
What mode of inheritance is occurring here?
Problem 6b
An inbred strain of plants has a mean height of 24 cm. A second strain of the same species from a different geographic region also has a mean height of 24 cm. When plants from the two strains are crossed together, the F₁ plants are the same height as the parent plants. However, the F₂ generation shows a wide range of heights; the majority are like the P₁ and F₁ plants, but approximately 4 of 1000 are only 12 cm high and about 4 of 1000 are 36 cm high.
How many gene pairs are involved?
Problem 6c
An inbred strain of plants has a mean height of 24 cm. A second strain of the same species from a different geographic region also has a mean height of 24 cm. When plants from the two strains are crossed together, the F₁ plants are the same height as the parent plants. However, the F₂ generation shows a wide range of heights; the majority are like the P₁ and F₁ plants, but approximately 4 of 1000 are only 12 cm high and about 4 of 1000 are 36 cm high.
How much does each gene contribute to plant height?
Problem 6d
An inbred strain of plants has a mean height of 24 cm. A second strain of the same species from a different geographic region also has a mean height of 24 cm. When plants from the two strains are crossed together, the F₁ plants are the same height as the parent plants. However, the F₂ generation shows a wide range of heights; the majority are like the P₁ and F₁ plants, but approximately 4 of 1000 are only 12 cm high and about 4 of 1000 are 36 cm high.
Indicate one possible set of genotypes for the original P₁ parents and the F₁ plants that could account for these results.
Problem 6e
An inbred strain of plants has a mean height of 24 cm. A second strain of the same species from a different geographic region also has a mean height of 24 cm. When plants from the two strains are crossed together, the F₁ plants are the same height as the parent plants. However, the F₂ generation shows a wide range of heights; the majority are like the P₁ and F₁ plants, but approximately 4 of 1000 are only 12 cm high and about 4 of 1000 are 36 cm high.
Indicate three possible genotypes that could account for F₂ plants that are 18 cm high and three that account for F₂ plants that are 33 cm high.
Problem 7a
Erma and Harvey were a compatible barnyard pair, but a curious sight. Harvey's tail was only 6 cm long, while Erma's was 30 cm. Their F₁ piglet offspring all grew tails that were 18 cm. When inbred, an F₂ generation resulted in many piglets (Erma and Harvey's grandpigs), whose tails ranged in 4-cm intervals from 6 to 30 cm (6, 10, 14, 18, 22, 26, and 30). Most had 18-cm tails, while 1/64 had 6-cm tails and 1/64 had 30-cm tails.
Explain how these tail lengths were inherited by describing the mode of inheritance, indicating how many gene pairs were at work, and designating the genotypes of Harvey, Erma, and their 18-cm-tail offspring.
Problem 7b
Erma and Harvey were a compatible barnyard pair, but a curious sight. Harvey's tail was only 6 cm long, while Erma's was 30 cm. Their F₁ piglet offspring all grew tails that were 18 cm. When inbred, an F₂ generation resulted in many piglets (Erma and Harvey's grandpigs), whose tails ranged in 4-cm intervals from 6 to 30 cm (6, 10, 14, 18, 22, 26, and 30). Most had 18-cm tails, while 1/64 had 6-cm tails and 1/64 had 30-cm tails.
If one of the 18-cm-tail F₁ pigs is mated with one of the 6-cm-tail F₂ pigs, what phenotypic ratio will be predicted if many offspring resulted? Diagram the cross.
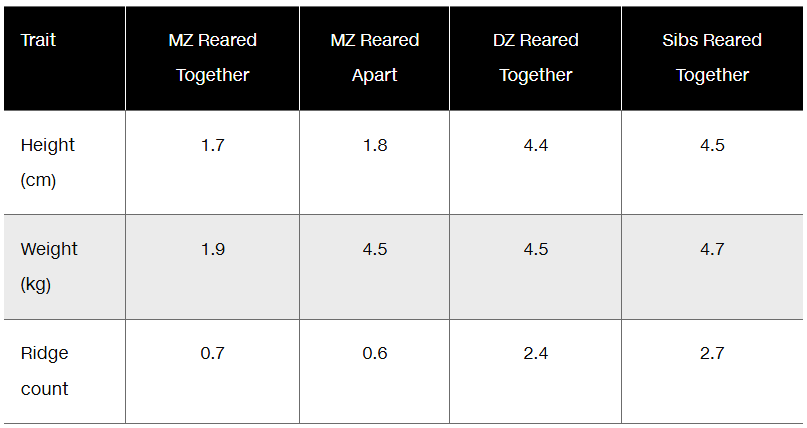
Problem 8
In the following table, average differences of height, weight, and fingerprint ridge count between monozygotic twins (reared together and apart), dizygotic twins, and nontwin siblings are compared:
Based on the data in this table, which of these quantitative traits has the highest heritability values?
Problem 9
What kind of heritability estimates (broad sense or narrow sense) are obtained from human twin studies?
Problem 10
List as many human traits as you can that are likely to be under the control of a polygenic mode of inheritance.
Problem 11
Corn plants from a test plot are measured, and the distribution of heights at 10-cm intervals is recorded in the following table:
Height (cm) Plants (no.)
100 20
110 60
120 90
130 130
140 180
150 120
160 70
170 50
180 40
Calculate
(a) the mean height,
(b) the variance,
(c) the standard deviation, and
(d) the standard error of the mean.
Plot a rough graph of plant height against frequency. Do the values represent a normal distribution? Based on your calculations, how would you assess the variation within this population?
Problem 12a
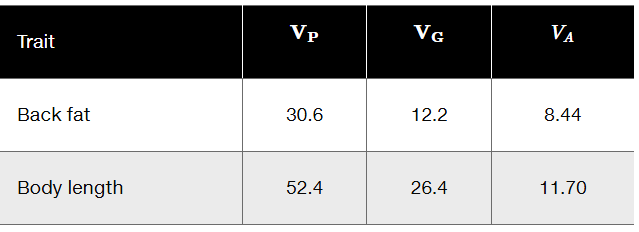
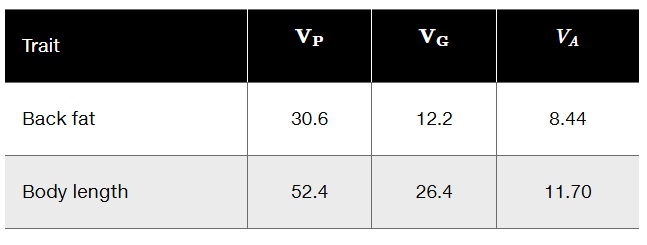
The following variances were calculated for two traits in a herd of hogs.
Calculate broad-sense (H²) and narrow-sense (h²) heritabilities for each trait in this herd.
Problem 12b
The following variances were calculated for two traits in a herd of hogs.
Which of the two traits will respond best to selection by a breeder? Why?
Problem 13
The mean and variance of plant height of two highly inbred strains (P₁ and P₂) and their progeny (F₁ and F₂) are shown here.
Strain Mean (cm) Variance
P₁ 34.2 4.2
P₂ 55.3 3.8
F₁ 44.2 5.6
F₂ 46.3 10.3
Calculate the broad-sense heritability (H²) of plant height in this species.
Problem 14a
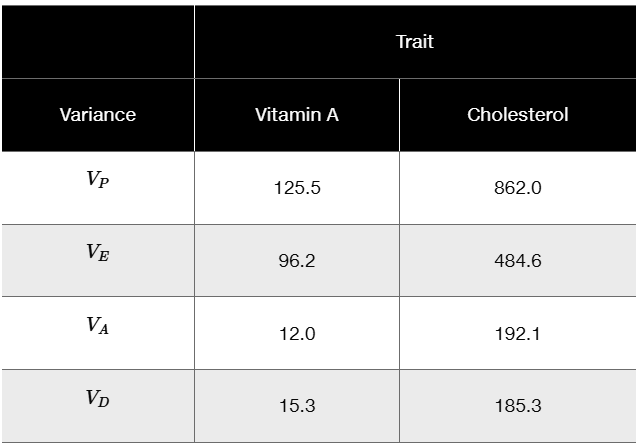
A hypothetical study investigated the vitamin A content and the cholesterol content of eggs from a large population of chickens. The following variances (V) were calculated.
Calculate the narrow-sense heritability (h²) for both traits.
Problem 14b
A hypothetical study investigated the vitamin A content and the cholesterol content of eggs from a large population of chickens. The following variances (V) were calculated.
Which trait, if either, is likely to respond to selection?
Problem 15
In a herd of dairy cows the narrow-sense heritability for milk protein content is 0.76, and for milk butterfat it is 0.82. The correlation coefficient between milk protein content and butterfat is 0.91. If the farmer selects for cows producing more butterfat in their milk, what will be the most likely effect on milk protein content in the next generation?