
 02:02
02:02
Textbook Question
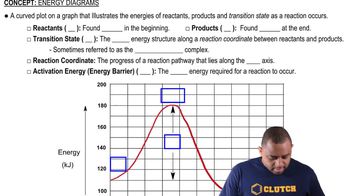
(a) The activation energy for the isomerization of methyl isonitrile (Figure 14.6) is 160 kJ>mol. Calculate the fraction of methyl isonitrile molecules that has an energy equal to or greater than the activation energy at 500 K. (b) Calculate this fraction for a temperature of 520 K. What is the ratio of the fraction at 520 K to that at 500 K?
1
views