Textbook Question
Beginning with the graphs of or , use shifting and scaling transformations to sketch the graph of the following functions. Use a graphing utility to check your work.
 Verified step by step guidanceVerified video answer for a similar problem:
 6:22
6:22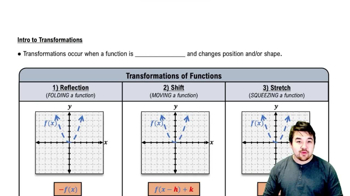 5:25
5:25 6:04
6:04 5:53m
5:53mMaster Graph of Sine and Cosine Function with a bite sized video explanation from Patrick
Start learning