Beginning with the graphs of y=sinx or y=cosx, use shifting and scaling transformations to sketch the graph of the following functions. Use a graphing utility to check your work. q(x)=3.6cos(24πx)+2
Verified step by step guidance
1
Start with the basic graph of y = \cos(x), which is a cosine wave with an amplitude of 1, a period of 2\pi, and a midline at y = 0.
Apply a horizontal scaling transformation to the function. The term \frac{\pi x}{24} inside the cosine function indicates a horizontal stretch. The period of the cosine function is given by \frac{2\pi}{\frac{\pi}{24}} = 48. This means the graph completes one full cycle over an interval of 48 units on the x-axis.
Apply a vertical scaling transformation. The coefficient 3.6 in front of the cosine function indicates a vertical stretch. This changes the amplitude of the cosine wave from 1 to 3.6, meaning the wave will oscillate between -3.6 and 3.6.
Apply a vertical shift. The +2 at the end of the function indicates a vertical shift upwards by 2 units. This moves the midline of the cosine wave from y = 0 to y = 2, so the wave will now oscillate between -1.6 and 5.6.
Combine all transformations to sketch the graph of q(x) = 3.6\cos\left(\frac{\pi x}{24}\right) + 2. The graph is a cosine wave with a period of 48, an amplitude of 3.6, and a midline at y = 2. Use a graphing utility to verify the transformations and the final graph.
Verified video answer for a similar problem:
This video solution was recommended by our tutors as helpful for the problem above
Video duration:
7m
Play a video:
0 Comments
Key Concepts
Here are the essential concepts you must grasp in order to answer the question correctly.
Trigonometric Functions
Trigonometric functions, such as sine and cosine, are fundamental periodic functions that describe relationships between angles and sides in triangles. They are essential for modeling oscillatory behavior and are defined on the unit circle. Understanding their properties, such as amplitude, period, and phase shift, is crucial for graphing and transforming these functions.
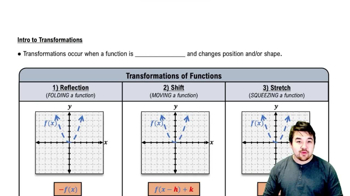
Transformations of functions involve shifting, stretching, compressing, or reflecting the graph of a function. For trigonometric functions, vertical shifts (adding or subtracting a constant) and horizontal shifts (changing the input variable) are common. These transformations allow us to manipulate the basic sine and cosine graphs to create new functions, such as the one given in the question.
Graphing utilities are tools, often software or calculators, that allow users to visualize mathematical functions and their transformations. They can plot complex functions, helping to verify manual calculations and understand the behavior of functions over a range of values. Using a graphing utility is particularly useful for checking the accuracy of sketches and understanding the effects of transformations on the graph.

 Verified step by step guidance
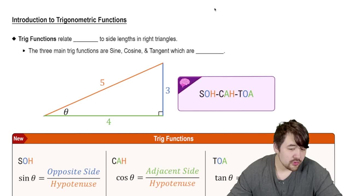
 6:04
6:04