Join thousands of students who trust us to help them ace their exams!Watch the first video
Multiple Choice
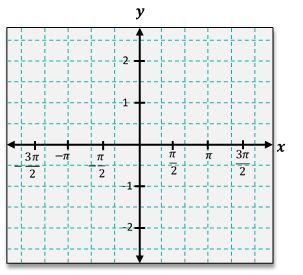
Sketch the function y=cos(x)−1 on the graph below.
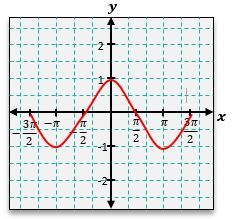
A
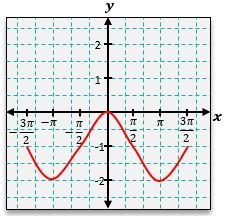
B
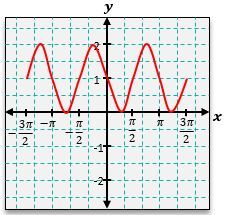
C
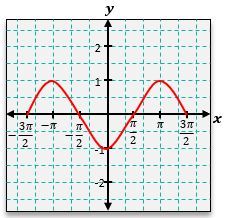
D
0 Comments
Verified step by step guidance
1
Step 1: Understand the function y = cos(x) - 1. This function is derived from the standard cosine function y = cos(x), but it is shifted downward by 1 unit. This means the entire graph of cos(x) is translated vertically.
Step 2: Identify the key points of the cosine function. The cosine function has a period of 2π, with key points at x = 0, π/2, π, 3π/2, and 2π. At these points, the values of cos(x) are 1, 0, -1, 0, and 1 respectively.
Step 3: Apply the vertical shift. Subtract 1 from each of the cosine values at the key points. For example, at x = 0, cos(0) = 1, so y = cos(0) - 1 = 0. Similarly, at x = π, cos(π) = -1, so y = cos(π) - 1 = -2.
Step 4: Plot the adjusted points on the graph. For example, at x = 0, y = 0; at x = π/2, y = -1; at x = π, y = -2; at x = 3π/2, y = -1; and at x = 2π, y = 0. Connect these points smoothly to form the graph.
Step 5: Verify the graph's shape and periodicity. The graph should resemble the cosine function but shifted downward by 1 unit. It should repeat every 2π, maintaining the same amplitude and frequency as the original cosine function.
 Verified step by step guidance
 5:53m
5:53m
