Determine the intervals for which the function is concave up or concave down. State the inflection points.
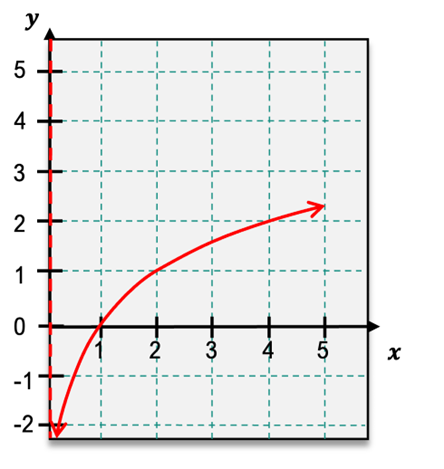
Table of contents
- 0. Functions4h 53m
- 1. Limits and Continuity2h 2m
- 2. Intro to Derivatives1h 33m
- 3. Techniques of Differentiation2h 18m
- 4. Derivatives of Exponential & Logarithmic Functions1h 16m
- 5. Applications of Derivatives2h 19m
- 6. Graphical Applications of Derivatives6h 0m
- 7. Antiderivatives & Indefinite Integrals48m
- 8. Definite Integrals4h 36m
- 9. Graphical Applications of Integrals1h 43m
- 10. Integrals of Inverse, Exponential, & Logarithmic Functions21m
- 11. Techniques of Integration2h 7m
- 12. Trigonometric Functions6h 54m
- Angles29m
- Trigonometric Functions on Right Triangles1h 8m
- Solving Right Triangles23m
- Trigonometric Functions on the Unit Circle1h 19m
- Graphs of Sine & Cosine46m
- Graphs of Other Trigonometric Functions32m
- Trigonometric Identities52m
- Derivatives of Trig Functions42m
- Integrals of Basic Trig Functions28m
- Integrals of Other Trig Functions10m
- 13: Intro to Differential Equations2h 23m
- 14. Sequences & Series2h 8m
- 15. Power Series2h 19m
- 16. Probability & Calculus45m
6. Graphical Applications of Derivatives
Concavity
Struggling with Business Calculus?
Join thousands of students who trust us to help them ace their exams!Watch the first videoMultiple Choice
For the following graph, find the open intervals for which the function is concave up or concave down. Identify any inflection points.

A
Concave down: (0,∞); No inflection pt
B
Concave down: (0,∞); Inflection pt: (0,0)
C
Concave up: (−∞,0); Concave down: (0,∞); Inflection pt: (0,0)
D
Concave down: (−∞,∞); No inflection pt

1
Step 1: Observe the graph and identify the behavior of the curve. The graph shows a function that starts steeply decreasing and then transitions to a gentler slope as x increases.
Step 2: Recall that concavity is determined by the second derivative of the function. If the second derivative is positive, the function is concave up; if negative, the function is concave down.
Step 3: Analyze the graph visually. From x = -∞ to x = 0, the curve appears to be concave up because the slope is increasing (becoming less steep). From x = 0 to x = ∞, the curve appears to be concave down because the slope is decreasing (becoming flatter).
Step 4: Identify the inflection point. An inflection point occurs where the concavity changes, which is at x = 0 in this graph. At this point, the function transitions from concave up to concave down.
Step 5: Summarize the intervals of concavity and the inflection point. The function is concave up on (-∞, 0), concave down on (0, ∞), and has an inflection point at (0, 0).
Watch next
Master Determining Concavity from the Graph of f with a bite sized video explanation from Patrick
Start learningRelated Videos
Related Practice
Multiple Choice