Join thousands of students who trust us to help them ace their exams!Watch the first video
Multiple Choice
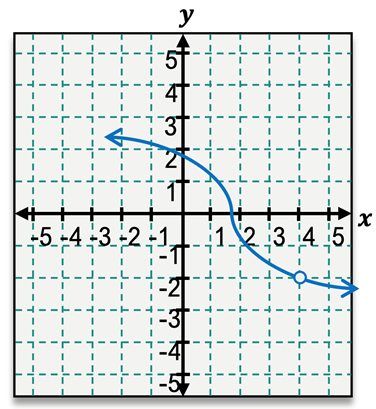
Find the limit using the graph of f(x)shown. limx→4f(x)
A
2
B
−2
C
0
D
Unable to determine
0 Comments
Verified step by step guidance
1
Step 1: Understand the problem. We are tasked with finding the limit of f(x) as x approaches 4 using the graph provided. This involves analyzing the behavior of the function f(x) as x gets closer to 4 from both the left and the right sides.
Step 2: Observe the graph near x = 4. Look at the values of f(x) as x approaches 4 from the left (x < 4) and from the right (x > 4). The graph shows a continuous curve leading to a specific y-value near x = 4.
Step 3: Identify the y-value that the graph approaches as x approaches 4. From the graph, trace the curve to see where it converges near x = 4. Note that the open circle at x = 4 indicates the function value at x = 4 is not defined, but the limit depends on the behavior of the graph as x approaches 4.
Step 4: Confirm that the left-hand limit and right-hand limit are equal. Check the graph to ensure that the y-value approached by the function is the same whether x approaches 4 from the left or the right. This confirms the existence of the limit.
Step 5: Conclude the limit. Based on the graph, the y-value that f(x) approaches as x approaches 4 is −2. This is the limit of f(x) as x approaches 4.
 Verified step by step guidance
 6:47m
6:47m
