Join thousands of students who trust us to help them ace their exams!
Multiple Choice
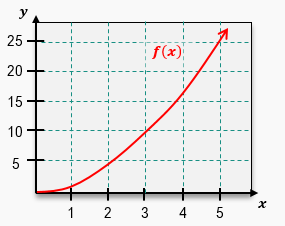
Use five rectangles to estimate the area under the curve of f(x)=x2 from x=0 to x=5 using left endpoints.
A
A=30
B
A=55
C
A=41.25
D
A=41.67
0 Comments
Verified step by step guidance
1
Step 1: Understand the problem. You are tasked with estimating the area under the curve f(x) = x^2 from x = 0 to x = 5 using five rectangles and the left endpoint method. The graph of f(x) = x^2 is provided.
Step 2: Divide the interval [0, 5] into 5 equal subintervals. The width of each rectangle (Δx) is calculated as Δx = (5 - 0)/5 = 1.
Step 3: Determine the left endpoints of each subinterval. The left endpoints are x = 0, x = 1, x = 2, x = 3, and x = 4.
Step 4: Evaluate the function f(x) = x^2 at each left endpoint to find the heights of the rectangles. The heights are f(0) = 0^2, f(1) = 1^2, f(2) = 2^2, f(3) = 3^2, and f(4) = 4^2.
Step 5: Multiply the height of each rectangle by the width (Δx = 1) and sum the areas of all rectangles to estimate the total area under the curve. The estimated area is Σ [f(x_i) * Δx] for i = 0 to 4.


 Verified step by step guidance
