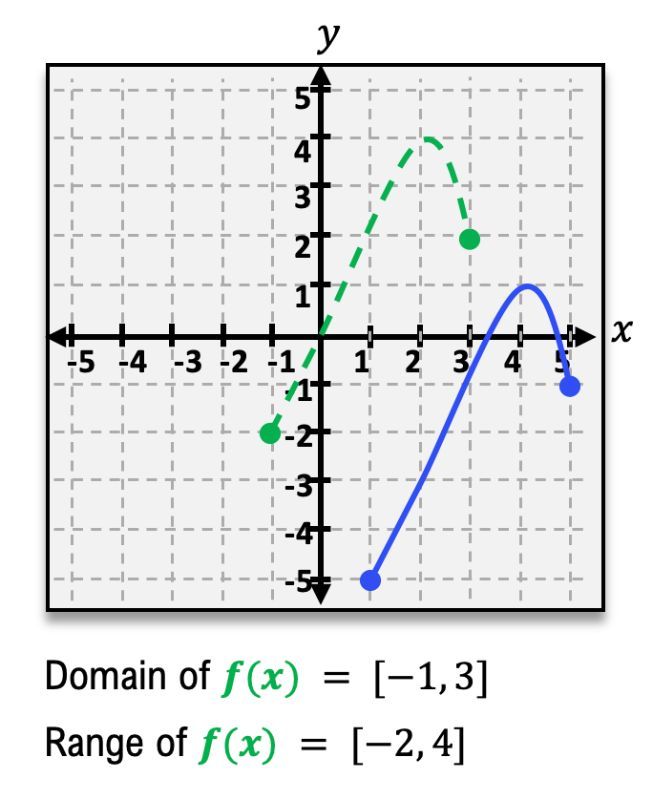
The green dotted line in the graph below represents the function . The blue solid line represents the function , which is the function after it has gone through a shift transformation. Find the equation for .
Table of contents
- 0. Review of College Algebra4h 43m
- 1. Measuring Angles40m
- 2. Trigonometric Functions on Right Triangles2h 5m
- 3. Unit Circle1h 19m
- 4. Graphing Trigonometric Functions1h 19m
- 5. Inverse Trigonometric Functions and Basic Trigonometric Equations1h 41m
- 6. Trigonometric Identities and More Equations2h 34m
- 7. Non-Right Triangles1h 38m
- 8. Vectors2h 25m
- 9. Polar Equations2h 5m
- 10. Parametric Equations1h 6m
- 11. Graphing Complex Numbers1h 7m
0. Review of College Algebra
Transformations
Struggling with Trigonometry?
Join thousands of students who trust us to help them ace their exams!Watch the first videoMultiple Choice
The green dotted curve below is a graph of the function f(x). Find the domain and range of g(x) (the blue solid curve), which is a transformation of f(x).

A
Dom: [1,4] , Ran: [−5,−1]
B
Dom: [1,5] , Ran: [−5,1]
C
Dom: [−1,3] , Ran: [−2,4]
D
Dom: [−2,3] , Ran: [2,4]

1
Observe the graph of the function f(x), which is represented by the green dotted curve. The domain of f(x) is given as [-1, 3], and the range is [-2, 4].
Now, look at the graph of the function g(x), represented by the blue solid curve. Notice how g(x) is a transformation of f(x).
To find the domain of g(x), identify the x-values over which the blue curve extends. The blue curve starts at x = -2 and ends at x = 3.
To find the range of g(x), identify the y-values that the blue curve covers. The lowest point on the blue curve is at y = 2, and the highest point is at y = 4.
Thus, the domain of g(x) is [-2, 3], and the range is [2, 4].
Watch next
Master Introduction to Transformations with a bite sized video explanation from Patrick
Start learningRelated Videos
Related Practice
Multiple Choice
Transformations practice set
