Back
BackProblem 1a
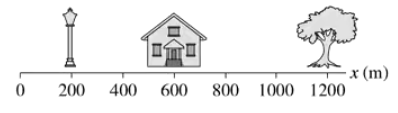
Larry leaves home at 9:05 and runs at constant speed to the lamppost seen in FIGURE EX2.1. He reaches the lamppost at 9:07, immediately turns, and runs to the tree. Larry arrives at the tree at 9:10. What is Larry's average velocity, in, during each of these two intervals?
Problem 1b
Larry leaves home at 9:05 and runs at constant speed to the lamppost seen in FIGURE EX2.1. He reaches the lamppost at 9:07, immediately turns, and runs to the tree. Larry arrives at the tree at 9:10. What is Larry's average velocity for the entire run?
Problem 2a
Julie drives 100 mi to Grandmother's house. On the way to Grandmother's, Julie drives half the distance at 40 mph and half the distance at 60 mph. On her return trip, she drives half the time at 40 mph and half the time at 60 mph. What is Julie's average speed on the way to Grandmother's house?
Problem 4a
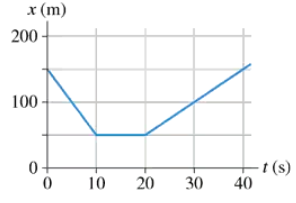
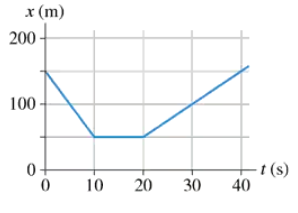
FIGURE EX2.4 is the position-versus-time graph of a bicycle. What is the bicycle's velocity at t = 5s
Problem 4c
FIGURE EX2.4 is the position-versus-time graph of a bicycle. What is the bicycle's velocity at t = 30s?
Problem 5a
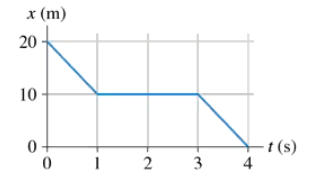
FIGURE EX2.5 shows the position graph of a particle. Draw the particle’s velocity graph for the interval .
Problem 6a
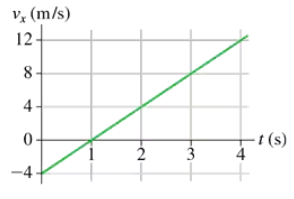
A particle starts from at and moves with the velocity graph shown in FIGURE EX2.6. Does this particle have a turning point? If so, at what time?
Problem 6b
A particle starts from x0 = 10 m at t0 = 0 s and moves with the velocity graph shown in FIGURE EX2.6. What is the object’s position at t = 2 s and 4 s?
Problem 8
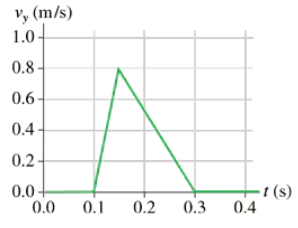
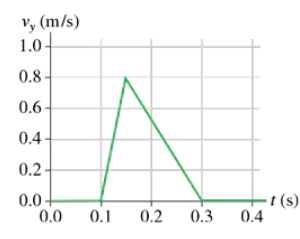
FIGURE EX2.8 is a somewhat idealized graph of the velocity of blood in the ascending aorta during one beat of the heart. Approximately how far, in cm, does the blood move during one beat?
Problem 9a
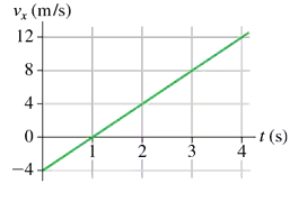
FIGURE EX2.9 shows the velocity graph of a particle. Draw the particle's acceleration graph for the interval 0 s ≤ t ≤ 4 s.
Problem 11
FIGURE EX2.8 showed the velocity graph of blood in the aorta. What is the blood's acceleration during each phase of the motion, speeding up and slowing down?
Problem 12a
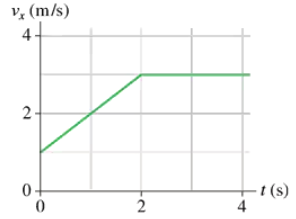
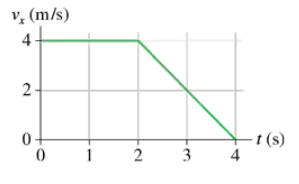
FIGURE EX2.12 shows the velocity-versus-time graph for a particle moving along the x-axis. Its initial position is at x0 = 2 m at t0 = 0 s. What are the particle's position, velocity, and acceleration at t = 1.0 s?
Problem 12b
FIGURE EX2.12 shows the velocity-versus-time graph for a particle moving along the x-axis. Its initial position is at x0 = 2 m at t0 = 0 s. What are the particle's position, velocity, and acceleration at t = 3.0 s?
Problem 13a
What constant acceleration, in SI units, must a car have to go from zero to 60 mph in 10 s?
Problem 13b
How far has the car traveled when it reaches 60 mph? Give your answer both in SI units and in feet.