Back
Back- A three-gene system of additive genes (A, B, and C) controls plant height. Each gene has two alleles (A and a, B and b, and C and c). There is dominance among the alleles of each gene, with alleles A, B, and C dominant over a, b, and c. Under this scheme, the dominant genotype for a gene contributes 10 cm to height potential, and the recessive genotype contributes 4 cm. What is the height potential of a plant that is homozygous for all three recessive alleles?
Problem 29
Problem 29a
A three-gene system of additive genes (A, B, and C) controls plant height. Each gene has two alleles (A and a, B and b, and C and c). There is dominance among the alleles of each gene, with alleles A, B, and C dominant over a, b, and c. Under this scheme, the dominant genotype for a gene contributes 10 cm to height potential, and the recessive genotype contributes 4 cm. What is the height potential of a plant that is homozygous for all three dominant alleles?
Problem 30
Congenital dislocation of the hip is a threshold condition in which the head of the femur (the femoral head) is out of its normal position relative to the bones that will form the socket of the hip (the acetabulum). This misplacement can lead to potentially serious orthopedic problems later in life if the condition is not treated in infancy. Numerous studies have shown that:
(a) Brothers and sisters of infants born with congenital hip dislocation are more likely to develop the condition than are the siblings of those without the condition. These studies also find that
(b) More female infants than male infants have the trait, and
(c) If the affected child is a girl, the risk to her siblings is lower than if the affected infant is a boy.
Explain the meaning of the three observations (a, b, and c) in the context of proposing a threshold model that explains these observations.
Problem 31a
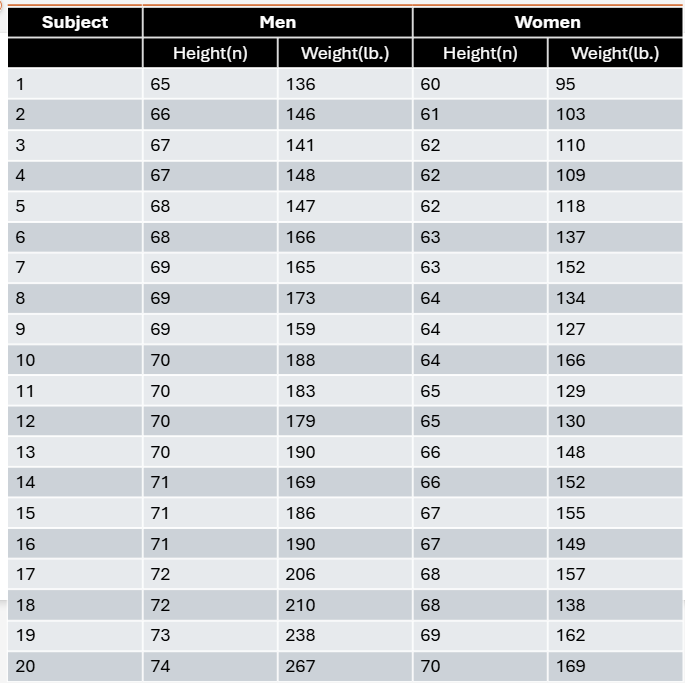
A total of 20 men and 20 women volunteer to participate in a statistics project. The height and weight of each subject are given in the table. Draw one histogram for the height of the subjects and a separate histogram for weight. Use different colors for men and women so that you can visually compare the distributions by sex and plot weights in 10-lb intervals (i.e., 90–99 lb, 100–109 lb, 110–119 lb, etc.).
Problem 31b
A total of 20 men and 20 women volunteer to participate in a statistics project. The height and weight of each subject are given in the table. Calculate the mean, variance, and standard deviation for height and weight in men and women.
Problem 31c
A total of 20 men and 20 women volunteer to participate in a statistics project. The height and weight of each subject are given in the table. Compare the numerical values with the visual distribution of heights and weights you drew in the histograms and describe whether you think your visual impression matches the numerical values.