Back
BackProblem 16a
In a line of cherry tomatoes, the average fruit weight is 16 g. A plant producing tomatoes with an average weight of 12 g is used in one self-fertilization cross to produce a line of smaller tomatoes, and a plant producing tomatoes of 24 g is used in a second cross to produce larger tomatoes. What is the selection differential (S) for fruit weight in each cross?
Problem 16b
In a line of cherry tomatoes, the average fruit weight is 16 g. A plant producing tomatoes with an average weight of 12 g is used in one self-fertilization cross to produce a line of smaller tomatoes, and a plant producing tomatoes of 24 g is used in a second cross to produce larger tomatoes. If narrow sense heritability (h²) for this trait is 0.80, what are the expected responses to selection (R) for fruit weight in the crosses?
Problem 17a
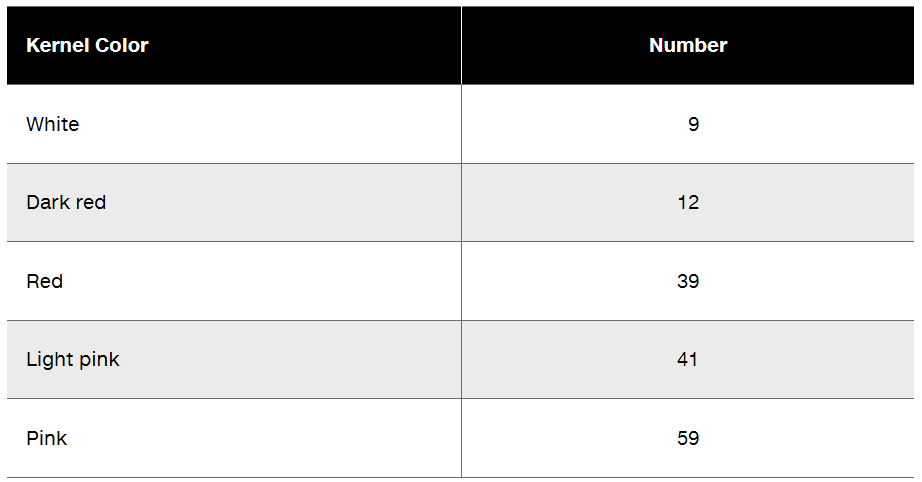
Two pure-breeding wheat strains, one producing dark red kernels and the other producing white kernels, are crossed to produce F₁ with pink kernel color. When an F₁ plant is self-fertilized and its seed collected and planted, the resulting F₂ consists of 160 plants with kernel colors as shown in the following table.
Based on the F₂ progeny, how many genes are involved in kernel color determination?
Problem 17b
Two pure-breeding wheat strains, one producing dark red kernels and the other producing white kernels, are crossed to produce F₁ with pink kernel color. When an F₁ plant is self-fertilized and its seed collected and planted, the resulting F₂ consists of 160 plants with kernel colors as shown in the following table.
How many additive alleles are required to explain the five phenotypes seen in the F₂?
Problem 17c
Two pure-breeding wheat strains, one producing dark red kernels and the other producing white kernels, are crossed to produce F₁ with pink kernel color. When an F₁ plant is self-fertilized and its seed collected and planted, the resulting F₂ consists of 160 plants with kernel colors as shown in the following table.
Using clearly defined allele symbols of your choice, give genotypes for the parental strains and the F₁. Describe the genotypes that produce the different phenotypes in the F₂.
Problem 17d
Two pure-breeding wheat strains, one producing dark red kernels and the other producing white kernels, are crossed to produce F₁ with pink kernel color. When an F₁ plant is self-fertilized and its seed collected and planted, the resulting F₂ consists of 160 plants with kernel colors as shown in the following table.
If an F₁ plant is crossed to a dark red plant, what are the expected progeny phenotypes, and what is the expected proportion of each phenotype?
Problem 18
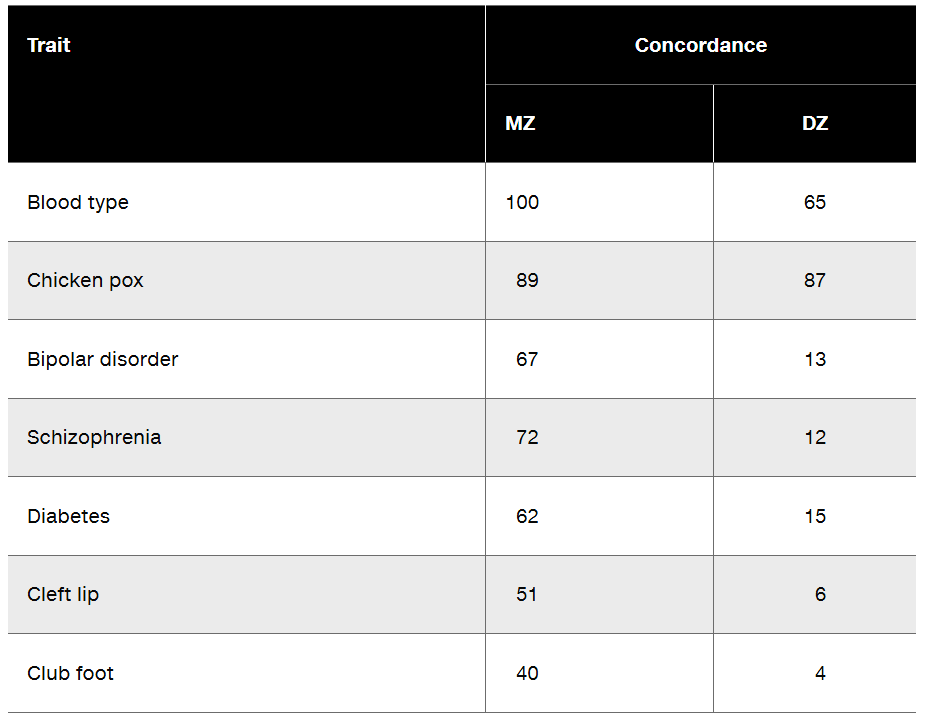
In studies of human MZ and DZ twin pairs of the same sex who are reared together, the following concordance values are identified for various traits. Based on the values shown, describe the relative importance of genes versus the influence of environmental factors for each trait.
Problem 19
During a visit, your grandparents comment on how tall you are compared with them. You tell them that in your genetics class, you learned that height in humans has high heritability, although environmental factors also influence adult height. You correctly explain the meaning of heritability, and your grandfather asks, 'How can height be highly heritable and still be influenced by the environment?' What explanation do you give your grandfather?
Problem 20
An association of racehorse owners is seeking a new genetic strategy to improve the running speed of their horses. Traditional breeding of fast male and female horses has proven expensive and time-consuming, and the breeders are interested in an approach using quantitative trait loci as a basis for selecting breeding pairs of horses. Write a brief synopsis (∼50 words) of QTL mapping to explain how genes influencing running speed might be identified in horses.
Problem 21a
Applied to the study of the human genome, a goal of GWAS is to locate chromosome regions that are likely to contain genes influencing the risk of disease. Specific genes can be identified in these regions, and particular mutant alleles that increase disease risk can be sequenced. To date, the identification of alleles that increase disease risk has occasionally led to a new therapeutic strategy, but more often the identification of disease alleles is the only outcome.
From a physician's point of view, what is the value of being able to identify alleles that increase the risk of a particular disease?
Problem 21b
Applied to the study of the human genome, a goal of GWAS is to locate chromosome regions that are likely to contain genes influencing the risk of disease. Specific genes can be identified in these regions, and particular mutant alleles that increase disease risk can be sequenced. To date, the identification of alleles that increase disease risk has occasionally led to a new therapeutic strategy, but more often the identification of disease alleles is the only outcome.
What is the value of being able to identify alleles that increase disease risk for a person who is currently free of the disease but who is at risk of developing the disease due to its presence in the family?
Problem 21c
Applied to the study of the human genome, a goal of GWAS is to locate chromosome regions that are likely to contain genes influencing the risk of disease. Specific genes can be identified in these regions, and particular mutant alleles that increase disease risk can be sequenced. To date, the identification of alleles that increase disease risk has occasionally led to a new therapeutic strategy, but more often the identification of disease alleles is the only outcome.
What personal or ethical issues arising from GWAS might be of concern to physicians or to those who might carry an allele that increases disease risk?
Problem 22a
Suppose a polygenic system for producing color in kernels of a grain is controlled by three additive genes, G, M, and T. There are two alleles of each gene, G₁ and G₂, M₁ and M₂, and T₁ and T₂. The phenotypic effects of the three genotypes of the G gene are G₁G₁ = 6 units of color, G₁G₂ = 3 units of color, and G₂G₂ = 1 unit of color. The phenotypic effects for genes M and T are similar, giving the phenotype of a plant with the genotype G₁G₁M₁M₁T₁T₁ a total of 18 units of color and a plant with the genotype G₂G₂M₂M₂T₂T₂ a total of 3 units of color.
How many units of color are found in trihybrid plants?
Problem 22b
Suppose a polygenic system for producing color in kernels of a grain is controlled by three additive genes, G, M, and T. There are two alleles of each gene, G₁ and G₂, M₁ and M₂, and T₁ and T₂. The phenotypic effects of the three genotypes of the G gene are G₁G₁ = 6 units of color, G₁G₂ = 3 units of color, and G₂G₂ = 1 unit of color. The phenotypic effects for genes M and T are similar, giving the phenotype of a plant with the genotype G₁G₁M₁M₁T₁T₁ a total of 18 units of color and a plant with the genotype G₂G₂M₂M₂T₂T₂ a total of 3 units of color.
Two trihybrid plants are mated. What is the expected proportion of progeny plants displaying 9 units of color? Explain your answer.
Problem 22c
Suppose a polygenic system for producing color in kernels of a grain is controlled by three additive genes, G, M, and T. There are two alleles of each gene, G₁ and G₂, M₁ and M₂, and T₁ and T₂. The phenotypic effects of the three genotypes of the G gene are G₁G₁ = 6 units of color, G₁G₂ = 3 units of color, and G₂G₂ = 1 unit of color. The phenotypic effects for genes M and T are similar, giving the phenotype of a plant with the genotype G₁G₁M₁M₁T₁T₁ a total of 18 units of color and a plant with the genotype G₂G₂M₂M₂T₂T₂ a total of 3 units of color. Suppose that instead of an additive genetic system, kernel-color determination in this organism is a threshold system. The appearance of color in kernels requires nine or more units of color; otherwise, kernels have no color and appear white. In other words, plants whose phenotypes contain eight or fewer units of color are white. Based on the threshold model, what proportion of the F₂ progeny produced by the trihybrid cross in part (b) will be white?
Explain your answer.
Problem 22d
Suppose a polygenic system for producing color in kernels of a grain is controlled by three additive genes, G, M, and T. There are two alleles of each gene, G₁ and G₂, M₁ and M₂, and T₁ and T₂. The phenotypic effects of the three genotypes of the G gene are G₁G₁ = 6 units of color, G₁G₂ = 3 units of color, and G₂G₂ = 1 unit of color. The phenotypic effects for genes M and T are similar, giving the phenotype of a plant with the genotype G₁G₁M₁M₁T₁T₁ a total of 18 units of color and a plant with the genotype G₂G₂M₂M₂T₂T₂ a total of 3 units of color.
Assuming the threshold model applies to this kernel-color system, what proportion of the progeny of the cross G₁G₂M₁M₂T₂T₂xG₁G₂M₁M₂T₁T₂ do you expect to display colored kernels?
Problem 23a
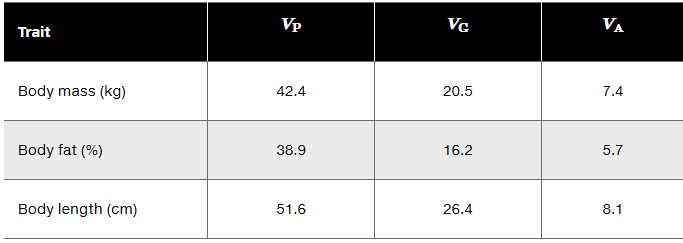
New Zealand lamb breeders measure the following variance values for their herd.
Calculate the broad sense heritability (H²) and the narrow sense heritability (h²) for each trait in this lamb herd.
Problem 23b
New Zealand lamb breeders measure the following variance values for their herd.
How would you characterize the potential response to selection (R) for each trait?
Problem 24a
Cattle breeders would like to improve the protein content and butterfat content of milk produced by a herd of cows. Narrow sense heritability values are 0.60 for protein content and 0.80 for butterfat content. The average percentages of these traits in the herd and the percentages of the traits in cows selected for breeding are as follows. Trait Herd Average Selected Cows Protein content 20.2% 22.7% Butterfat content 6.5% 7.4% Determine the selection differential (S) for each trait in this herd.
Problem 24b
Cattle breeders would like to improve the protein content and butterfat content of milk produced by a herd of cows. Narrow sense heritability values are 0.60 for protein content and 0.80 for butterfat content. The average percentages of these traits in the herd and the percentages of the traits in cows selected for breeding are as follows. Trait Herd Average Selected Cows Protein content 20.2% 22.7% Butterfat content 6.5% 7.4% Which trait is likely to be the most responsive to artificial selection applied by the cattle breeders through selection of cows for mating?
Problem 25a
In human gestational development, abnormalities of the closure of the lower part of the mid-face can result in cleft lip, if the lip alone is affected by the closure defect, or in cleft lip and palate (the roof of the mouth), if the closure defect is more extensive. Cleft lip and cleft lip with cleft palate are multifactorial disorders that are threshold traits. A family with a history of either condition has a significantly increased chance of a recurrence of mid-face cleft disorder in comparison with families without such a history. However, the recurrence risk of a mid-face cleft disorder is higher in families with a history of cleft lip with cleft palate than in families with a history of cleft lip alone. Suppose a friend of yours who has not taken genetics asks you to explain these observations. Construct a genetic explanation for the increased recurrence risk of mid-face clefting in families that have a history of cleft disorders versus families without a history of such disorders.
Problem 25b
In human gestational development, abnormalities of the closure of the lower part of the mid-face can result in cleft lip, if the lip alone is affected by the closure defect, or in cleft lip and palate (the roof of the mouth), if the closure defect is more extensive. Cleft lip and cleft lip with cleft palate are multifactorial disorders that are threshold traits. A family with a history of either condition has a significantly increased chance of a recurrence of mid-face cleft disorder in comparison with families without such a history. However, the recurrence risk of a mid-face cleft disorder is higher in families with a history of cleft lip with cleft palate than in families with a history of cleft lip alone. Construct a similar explanation of why the recurrence risk of a cleft disorder is higher in families with a history of cleft lip with cleft palate than in families with a history of cleft lip alone.
Problem 26a
The children of couples in which one partner has blood type O (genotype ii) and the other partner has blood type AB (genotype IᴬIᴮ) are studied. What is the expected concordance rate for blood type of MZ twins in this study? Explain your answer.
Problem 26b
The children of couples in which one partner has blood type O (genotype ii) and the other partner has blood type AB (genotype IᴬIᴮ) are studied. What is the expected concordance rate for blood type of DZ twins in this study? Explain why this answer is different from the answer to part (a).
Problem 27a
Answer the following in regard to multifactorial traits in human twins. If the trait is substantially influenced by genes, would you expect the concordance rate to be higher in MZ twins or higher in DZ twins? Explain your reasoning.
Problem 27b
Answer the following in regard to multifactorial traits in human twins. If the trait is produced with little contribution from genetic variation, what would you expect to see if you compared the concordance rates of MZ twins versus DZ twins? Explain your reasoning.
- Suppose the mature height of a plant is a multifactorial trait under the control of five independently assorting genes, designated A, B, C, D, and E, and five environmental factors. There are two alleles of each gene (A₁, A₂, etc.). Each allele with a subscript 1 (i.e., A₁) contributes 5 cm to potential plant height, and each allele with a 2 subscript (i.e., A₂, etc.) contributes 10 cm to potential plant height. In other words, a genotype containing only 1 alleles (A₁A₁B₁B₁C₁C₁D₁D₁E₁E₁) would have a potential height of [(10)(5)]=50 cm, and a genotype with only 2 alleles (A₂A₂B₂B₂C₂C₂D₂D₂E₂E₂) would have a potential height of [(10)(10)]=100 cm. The five environmental factors are (1) amount of water, (2) amount of sunlight, (3) soil drainage, (4) nutrient content of soil, and (5) temperature. Each environmental factor can vary from optimal to poor. If all factors are optimal, assume that full potential height is attained. However, if one or more of the environmental factors is less than optimal, then height is reduced. The state of each environmental factor has an effect on growth. In this exercise, we'll assume that the growth is affected according to the following scale: Environmental Factor State Height Lost Optimal (O) 0 cm Good (G) 4 cm Fair (F) 8 cm Marginal (M) 12 cm Poor (P) 16 cm Thus, for example, if one environmental factor is optimal, two are good, one is fair, and one is marginal, the loss of potential height is . If the loss of height potential is greater than the height potential of the plant, the plant does not survive. How many 1 and 2 alleles must be present to give a height potential of 80 cm?
Problem 28
- Suppose the mature height of a plant is a multifactorial trait under the control of five independently assorting genes, designated A, B, C, D, and E, and five environmental factors. There are two alleles of each gene (A₁, A₂, etc.). Each allele with a subscript 1 (i.e., A₁) contributes 5 cm to potential plant height, and each allele with a 2 subscript (i.e., A₂, etc.) contributes 10 cm to potential plant height. In other words, a genotype containing only 1 alleles (A₁A₁B₁B₁C₁C₁D₁D₁E₁E₁) would have a potential height of [(10)(5)]=50 cm, and a genotype with only 2 alleles (A₂A₂B₂B₂C₂C₂D₂D₂E₂E₂) would have a potential height of [(10)(10)]=100 cm. The five environmental factors are (1) amount of water, (2) amount of sunlight, (3) soil drainage, (4) nutrient content of soil, and (5) temperature. Each environmental factor can vary from optimal to poor. If all factors are optimal, assume that full potential height is attained. However, if one or more of the environmental factors is less than optimal, then height is reduced. The state of each environmental factor has an effect on growth. In this exercise, we'll assume that the growth is affected according to the following scale: Environmental Factor State Height Lost Optimal (O) 0 cm Good (G) 4 cm Fair (F) 8 cm Marginal (M) 12 cm Poor (P) 16 cm Thus, for example, if one environmental factor is optimal, two are good, one is fair, and one is marginal, the loss of potential height is . If the loss of height potential is greater than the height potential of the plant, the plant does not survive. List two genotypes that have a height potential of 80 cm.
Problem 28
Problem 28a
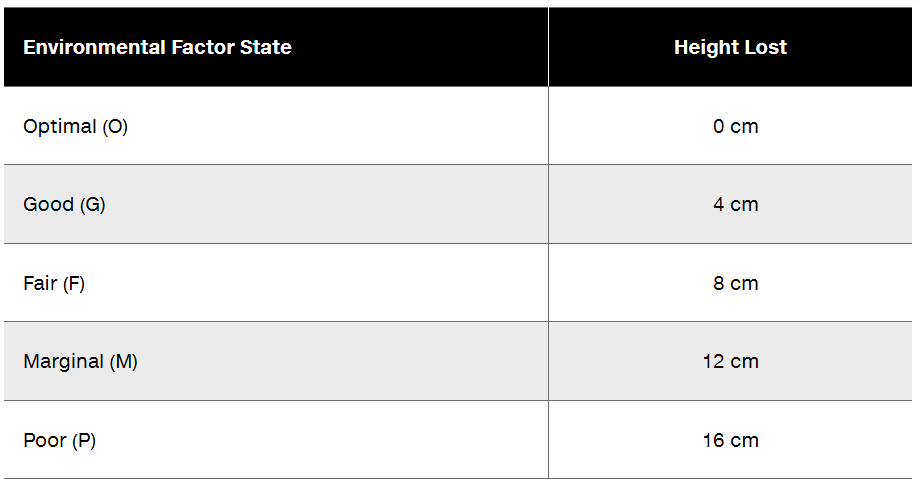
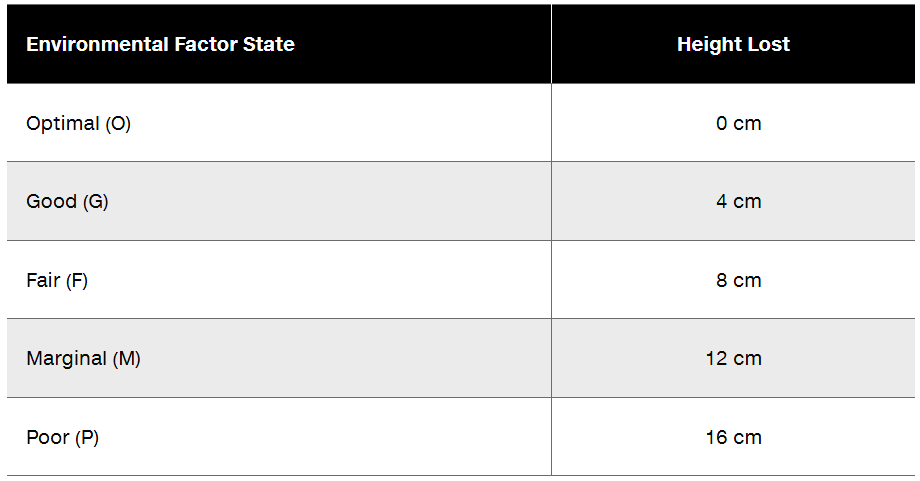
Suppose the mature height of a plant is a multifactorial trait under the control of five independently assorting genes, designated A, B, C, D, and E, and five environmental factors. There are two alleles of each gene (A₁, A₂, etc.). Each allele with a subscript 1 (i.e., A₁) contributes 5 cm to potential plant height, and each allele with a subscript 2 (i.e., A₂, etc.) contributes 10 cm to potential plant height. In other words, a genotype containing only 1 allele (A₁A₁B₁B₁C₁C₁D₁D₁E₁E₁) would have a potential height of [(10)(5)]=50 cm, and a genotype with only 2 alleles (A₂A₂B₂B₂C₂C₂D₂D₂E₂E₂) would have a potential height of [(10)(10)]=100 cm. The five environmental factors are (1) amount of water, (2) amount of sunlight, (3) soil drainage, (4) nutrient content of soil, and (5) temperature. Each environmental factor can vary from optimal to poor. If all factors are optimal, assume that full potential height is attained. However, if one or more of the environmental factors is less than optimal, then height is reduced. The state of each environmental factor has an effect on growth. In this exercise, we'll assume that the growth is affected according to the following scale:
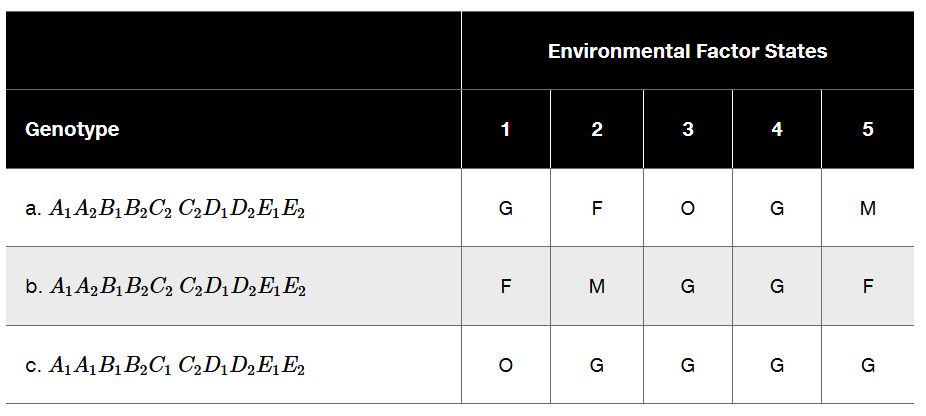
Thus, for example, if one environmental factor is optimal, two are good, one is fair, and one is marginal, the loss of potential height is 0 + 4 + 4 + 8 + 12 = 28 cm. If the loss of height potential is greater than the height potential of the plant, the plant does not survive. Calculate the potential height, based on inherited alleles, and the attained height, based on growth in the environmental circumstances given, for the three plants (a, b, and c) in the accompanying table.
Problem 28d
Suppose the mature height of a plant is a multifactorial trait under the control of five independently assorting genes, designated A, B, C, D, and E, and five environmental factors. There are two alleles of each gene (A₁, A₂, etc.). Each allele with a subscript 1 (i.e., A₁) contributes 5 cm to potential plant height, and each allele with a subscript 2 (i.e., A₂, etc.) contributes 10 cm to potential plant height. In other words, a genotype containing only 1 allele (A₁A₁B₁B₁C₁C₁D₁D₁E₁E₁) would have a potential height of [(10)(5)]=50 cm, and a genotype with only 2 alleles (A₂A₂B₂B₂C₂C₂D₂D₂E₂E₂) would have a potential height of [(10)(10)]=100 cm. The five environmental factors are (1) amount of water, (2) amount of sunlight, (3) soil drainage, (4) nutrient content of soil, and (5) temperature. Each environmental factor can vary from optimal to poor. If all factors are optimal, assume that full potential height is attained. However, if one or more of the environmental factors is less than optimal, then height is reduced. The state of each environmental factor has an effect on growth. In this exercise, we'll assume that the growth is affected according to the following scale:
Thus, for example, if one environmental factor is optimal, two are good, one is fair, and one is marginal, the loss of potential height is 0 + 4 + 4 + 8 + 12 = 28 cm. If the loss of height potential is greater than the height potential of the plant, the plant does not survive. If two plants that each have a height potential of 75 cm are crossed, what proportion of the progeny will have a height potential of 80 cm?.