Textbook Question
Consider the reaction: NO2(g) → NO(g) + 1/2 O2( g) The tabulated data were collected for the concentration of NO2 as a function of time: b. What is the rate of formation of O2 between 50 and 60 s?
 Verified step by step guidance
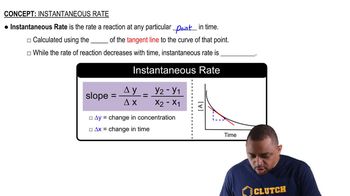
 01:30
01:30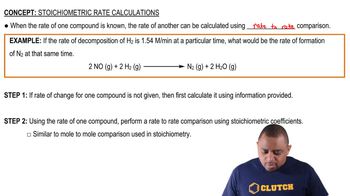 02:28
02:28 03:13
03:13Consider the reaction: NO2(g) → NO(g) + 1/2 O2( g) The tabulated data were collected for the concentration of NO2 as a function of time: b. What is the rate of formation of O2 between 50 and 60 s?
Consider the reaction: H2(g) + Br2(g) → 2 HBr(g) The graph shows the concentration of Br2 as a function of time.
a. Use the graph to calculate each quantity: (i) the average rate of the reaction between 0 and 25 s
Consider the reaction: H2( g) + Br2( g) → 2 HBr( g) The graph shows the concentration of Br2 as a function of time.
b. Make a rough sketch of a curve representing the concentration of HBr as a function of time. Assume that the initial concentration of HBr is zero
Consider the reaction: 2 H2O2(aq) → 2 H2O(l ) + O2( g) The graph shows the concentration of H2O2 as a function of time.
Use the graph to calculate each quantity: c. the instantaneous rate of formation of O2 at 50 s