Ch.11 - Liquids & Phase Changes
Chapter 11, Problem 64

How many phase transitions did you pass through in Problem 11.62, and what are they?

Verified step by step guidance
1
Step 1: Identify the initial and final states of the substance in Problem 11.62. Determine the phases involved (e.g., solid, liquid, gas).
Step 2: List the possible phase transitions that can occur between these states. Common phase transitions include melting (solid to liquid), freezing (liquid to solid), vaporization (liquid to gas), condensation (gas to liquid), sublimation (solid to gas), and deposition (gas to solid).
Step 3: Analyze the process described in Problem 11.62 to determine which of these phase transitions actually occur. Consider the conditions such as temperature and pressure changes that might induce these transitions.
Step 4: Count the number of distinct phase transitions that occur as the substance moves from its initial to final state.
Step 5: Summarize the phase transitions identified, providing a brief description of each transition in the context of the problem.

Key Concepts

Here are the essential concepts you must grasp in order to answer the question correctly.

Phase Transitions

Phase transitions refer to the changes in the state of matter, such as from solid to liquid (melting), liquid to gas (vaporization), and vice versa. These transitions occur at specific temperatures and pressures, and they involve energy changes, typically in the form of heat. Understanding these transitions is crucial for analyzing physical processes and the behavior of substances under varying conditions.
Recommended video:
Guided course
03:22
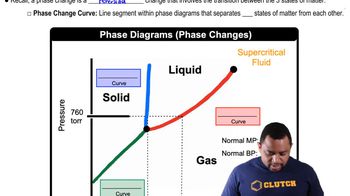
Phase Changes in Diagrams

Thermodynamics

Thermodynamics is the branch of physics that deals with heat, work, and energy transformations. It provides the principles governing phase transitions, including the concepts of enthalpy and entropy. By applying thermodynamic principles, one can predict how a substance will behave during a phase change, including the energy required for the transition and the conditions under which it occurs.
Recommended video:
Guided course
01:18
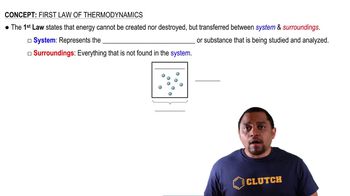
First Law of Thermodynamics

Phase Diagrams

Phase diagrams are graphical representations that show the phases of a substance at various temperatures and pressures. They illustrate the conditions under which different phases coexist and the boundaries between them, known as phase boundaries. Analyzing phase diagrams helps in understanding the specific phase transitions a substance undergoes, as well as the critical points where these transitions occur.
Recommended video:
Guided course
03:22
Phase Changes in Diagrams
Related Practice
Textbook Question
Water at room temperature is placed in a flask connected by rubber tubing to a vacuum pump, and the pump is turned on. After several minutes, the volume of the water has decreased, and what remains has turned to ice. Explain
1
views
Textbook Question
Benzene has a melting point of 5.53 °C and a boiling point of 80.09 °C at atmospheric pressure. Its density is0.8787 g>cm3 when liquid and 0.899 g>cm3 when solid; it has Tc = 289.01 °C, Pc = 48.34 atm, Tt = 5.52 °C, and Pt = 0.0473 atm. Starting from a point at 200 K and66.5 atm, trace the following path on a phase diagram. (1) First, increase T to 585 K while keeping P constant.(2) Next, decrease P to 38.5 atm while keeping T constant.(3) Then, decrease T to 278.66 K while keeping P constant.(4) Finally, decrease P to 0.0025 atm while keeping Tconstant.What is your starting phase, and what is your final phase?
1
views
Textbook Question
Intermolecular forces are important in creating ordered arrangements in liquid crystals. What types of intermolecu- lar forces exist in a sample of the following compound?

Textbook Question

Two compounds (labeled I and II) have a liquid crystal state. Predict which compound has a higher temperature associ- ated with the solid to liquid crystal phase change. Explain your reasoning.
Textbook Question
The compound cholesteryl benzoate is a rod-like molecule that undergoes a phase change from the solid to the liq- uid crystal phase at 145.5 °C. When cholesteryl benzoate is mixed with cholesteryl oleyl carbonate, a molecule with a curved shape, the temperature of the solid to liquid crys- tal transition changes. Predict if the transition temperature increases or decreases and explain your reasoning.