Ch.2 - Atoms, Molecules, and Ions
Chapter 2, Problem 39

Naturally occurring lead has the following isotopic abundances: Isotope Abundance (%) Atomic mass (u) 204Pb 1.4 203.9730, 206Pb 24.1 205.9744, 207Pb 22.1 206.9759, 208Pb 52.4 207.9766. (a) What is the average atomic mass of Pb? (b) Sketch the mass spectrum of Pb.

Verified step by step guidance
1
Step 1: Understand that the average atomic mass of an element is calculated using the isotopic abundances and their respective atomic masses. The formula to calculate the average atomic mass is: \( \text{Average Atomic Mass} = \sum (\text{Fractional Abundance} \times \text{Atomic Mass}) \).
Step 2: Convert the percentage abundances of each isotope into fractional abundances by dividing each percentage by 100. For example, for \( ^{204}\text{Pb} \), the fractional abundance is \( \frac{1.4}{100} = 0.014 \).
Step 3: Multiply the fractional abundance of each isotope by its respective atomic mass. For example, for \( ^{204}\text{Pb} \), calculate \( 0.014 \times 203.9730 \). Repeat this for each isotope.
Step 4: Sum the products obtained from Step 3 to find the average atomic mass of lead. This sum represents the weighted average of the atomic masses based on their natural abundances.
Step 5: To sketch the mass spectrum of Pb, plot the isotopic masses on the x-axis and their relative abundances (as percentages) on the y-axis. Each isotope will be represented by a peak, with the height of each peak corresponding to its abundance.

Key Concepts

Here are the essential concepts you must grasp in order to answer the question correctly.

Isotopes and Atomic Mass

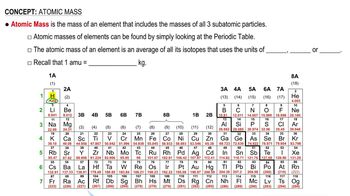
Isotopes are variants of a chemical element that have the same number of protons but different numbers of neutrons, resulting in different atomic masses. The average atomic mass of an element is calculated by taking the weighted average of the masses of its isotopes, considering their relative abundances. This concept is crucial for understanding how to compute the average atomic mass of lead (Pb) based on the provided isotopic data.
Recommended video:

Weighted Average Calculation

A weighted average is a mean that takes into account the relative importance or frequency of each value. In the context of isotopes, the abundance percentage of each isotope serves as the weight in the calculation of the average atomic mass. This method ensures that isotopes with higher abundances have a greater influence on the final average, which is essential for accurately determining the average atomic mass of lead.
Recommended video:
Guided course
02:42
Average Rate Calculation Example

Mass Spectrum

A mass spectrum is a graphical representation of the mass-to-charge ratio of ions, which helps identify the different isotopes of an element and their relative abundances. In a mass spectrum, peaks correspond to isotopes, with the height of each peak representing the abundance of that isotope. Understanding how to sketch a mass spectrum for lead involves plotting the isotopes along the x-axis and their respective abundances on the y-axis, providing a visual representation of the isotopic composition.
Recommended video:
Guided course
02:53
Electromagnetic Spectrum
Related Practice
Textbook Question

(a) Thomson's cathode-ray tube (Figure 2.4) and the mass spectrometer (Figure 2.11) both involve the use of electric or magnetic fields to deflect charged particles. What are the charged particles involved in each of these experiments?
13
views
Textbook Question

Consider the mass spectrometer shown in Figure 2.11. Determine whether each of the following statements is true or false. If false, correct the statement to make it true: (a) The paths of neutral (uncharged) atoms are not affected by the magnet.

Textbook Question

Consider the mass spectrometer shown in Figure 2.11. Determine whether each of the following statements is true or false. If false, correct the statement to make it true: (b) The height of each peak in the mass spectrum is inversely proportional to the mass of that isotope.

1
views
Textbook Question

Massspectrometry is more often applied to molecules than to atoms. We will see in Chapter 3 that the molecular weight of a molecule is the sum of the atomic weights of the atoms in the molecule. The mass spectrum of H2 is taken under conditions that prevent decomposition into H atoms. The two naturally occurring isotopes of hydrogen are 1H (atomic mass = 1.00783 amu; abundance 99.9885%) and 2H (atomic mass = 2.01410; abundance 0.0115%). (a) How many peaks will the mass spectrum have?

Textbook Question

Massspectrometry is more often applied to molecules than to atoms. We will see in Chapter 3 that the molecular weight of a molecule is the sum of the atomic weights of the atoms in the molecule. The mass spectrum of H2 is taken under conditions that prevent decomposition into H atoms. The two naturally occurring isotopes of hydrogen are 1H (atomic mass = 1.00783 amu; abundance 99.9885%) and 2H (atomic mass = 2.01410; abundance 0.0115%). (c) Which peak will be the largest, and which the smallest?

Textbook Question

For each of the following elements, write its chemical symbol, locate it in the periodic table, give its atomic number, and indicate whether it is a metal, metalloid, or nonmetal: (a) radon (b) tellurium (c) cadmium (d) chromium (e) barium (f) selenium (g) arsenic.