How do you obtain the graph of from the graph of ?
Table of contents
- 0. Functions7h 55m
- Introduction to Functions18m
- Piecewise Functions10m
- Properties of Functions9m
- Common Functions1h 8m
- Transformations5m
- Combining Functions27m
- Exponent rules32m
- Exponential Functions28m
- Logarithmic Functions24m
- Properties of Logarithms36m
- Exponential & Logarithmic Equations35m
- Introduction to Trigonometric Functions38m
- Graphs of Trigonometric Functions44m
- Trigonometric Identities47m
- Inverse Trigonometric Functions48m
- 1. Limits and Continuity2h 2m
- 2. Intro to Derivatives1h 33m
- 3. Techniques of Differentiation3h 18m
- 4. Applications of Derivatives2h 38m
- 5. Graphical Applications of Derivatives6h 2m
- 6. Derivatives of Inverse, Exponential, & Logarithmic Functions2h 37m
- 7. Antiderivatives & Indefinite Integrals1h 26m
- 8. Definite Integrals4h 44m
- 9. Graphical Applications of Integrals2h 27m
- 10. Physics Applications of Integrals 3h 16m
- 11. Integrals of Inverse, Exponential, & Logarithmic Functions2h 31m
- 12. Techniques of Integration7h 41m
- 13. Intro to Differential Equations2h 55m
- 14. Sequences & Series5h 36m
- 15. Power Series2h 19m
- 16. Parametric Equations & Polar Coordinates7h 58m
0. Functions
Transformations
Problem 14e
Textbook Question
Use the graph of f in the figure to plot the following functions.
<IMAGE>
y=f(x−1)+2
 Verified step by step guidance
1
Identify the transformation components in the function y = f(x-1) + 2. The function involves a horizontal shift and a vertical shift.
Recognize that the expression (x-1) indicates a horizontal shift. Specifically, f(x-1) represents a shift of the graph of f(x) to the right by 1 unit.
Understand that the '+2' outside the function indicates a vertical shift. This means that after shifting the graph to the right, you will move it up by 2 units.
Start by taking each point on the original graph of f(x) and apply the horizontal shift. Move each point 1 unit to the right.
After applying the horizontal shift, apply the vertical shift by moving each of the new points 2 units up. Plot these new points to obtain the graph of y = f(x-1) + 2.
 Verified video answer for a similar problem:
This video solution was recommended by our tutors as helpful for the problem above
Video duration:
5mPlay a video:
0 Comments
Key Concepts
Here are the essential concepts you must grasp in order to answer the question correctly.
Function Transformation
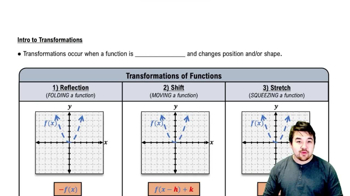
Function transformation refers to the changes made to the graph of a function through operations such as shifting, stretching, or reflecting. In the given equation, y = f(x - 1) + 2, the function f is shifted to the right by 1 unit and then raised vertically by 2 units. Understanding these transformations is crucial for accurately plotting the new function based on the original graph.
Recommended video:

Intro to Transformations
Horizontal Shift
A horizontal shift occurs when a function is moved left or right along the x-axis. In the expression f(x - 1), the subtraction of 1 indicates a shift to the right by 1 unit. This concept is essential for determining how the input values of the function are altered, affecting the overall position of the graph.
Recommended video:

Horizontal Parabolas
Vertical Shift
A vertical shift involves moving a function up or down along the y-axis. In the equation y = f(x - 1) + 2, the addition of 2 results in a vertical shift upwards by 2 units. This concept helps in understanding how the output values of the function are adjusted, which is necessary for accurately plotting the transformed function.
Recommended video:

Foci and Vertices of an Ellipse

 5:25m
5:25mWatch next
Master Intro to Transformations with a bite sized video explanation from Patrick
Start learningRelated Videos
Related Practice
Textbook Question
