Here are the essential concepts you must grasp in order to answer the question correctly.
Graphing Functions
Graphing functions involves plotting points on a coordinate plane to visualize the behavior of a function. This helps in understanding how the function behaves at different values of x, including identifying key features such as intercepts, asymptotes, and critical points. Technology tools like graphing calculators or software can assist in accurately plotting complex functions.
Recommended video:
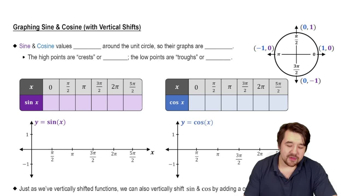
Graph of Sine and Cosine Function
Behavior Near Specific Points
Analyzing the behavior of a graph near specific points, such as x = 1 and x = -1, involves examining the function's limits and continuity. This includes determining if the function approaches a particular value, becomes undefined, or exhibits asymptotic behavior. Understanding these behaviors is crucial for predicting the function's behavior in the vicinity of these points.
Recommended video:
Fractional Exponents
Fractional exponents, such as ²/³, indicate roots and powers simultaneously. In the function y = (3/2)(x − (1 / x))²/³, the exponent affects the shape and smoothness of the graph. It implies taking the cube root and then squaring the result, which can lead to unique graph characteristics, especially near points where the base expression approaches zero or infinity.
Recommended video:
Introduction to Exponent Rules