Textbook Question
49–54. {Use of Tech} Graphing with technology Make a complete graph of the following functions. A graphing utility is useful in locating intercepts, local extreme values, and inflection points.
ƒ(x) = 3x⁴ + 4x³ - 12x²
 Verified step by step guidanceVerified video answer for a similar problem:
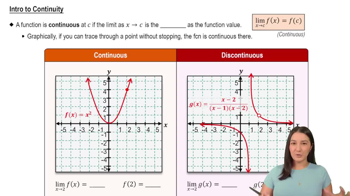
 05:34
05:34 04:50
04:50 06:15
06:15 11:41m
Master Summary of Curve Sketching with a bite sized video explanation from Patrick
Start learning