Here are the essential concepts you must grasp in order to answer the question correctly.
Derivative and Its Graph
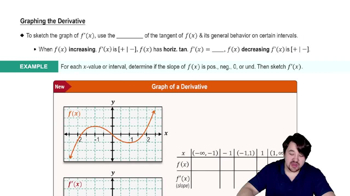
The derivative of a function, denoted as f', represents the rate of change of the function at any given point. The graph of f' indicates where the original function f is increasing or decreasing. If f' is positive, f is increasing; if f' is negative, f is decreasing. Understanding the behavior of f' is crucial for sketching the graph of f.
Recommended video:
Second Derivative and Its Graph
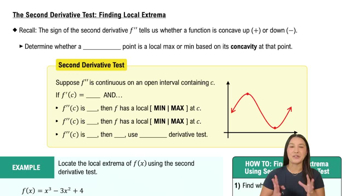
The second derivative, denoted as f'', measures the rate of change of the first derivative. It provides information about the concavity of the function f. If f'' is positive, the graph of f is concave up, indicating a local minimum; if f'' is negative, the graph is concave down, indicating a local maximum. This concept is essential for determining the shape of the graph of f.
Recommended video:
The Second Derivative Test: Finding Local Extrema
Critical Points and Inflection Points
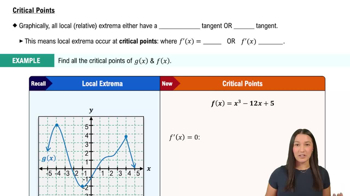
Critical points occur where the first derivative f' is zero or undefined, indicating potential local maxima or minima. Inflection points occur where the second derivative f'' changes sign, indicating a change in concavity. Identifying these points is vital for accurately plotting the graph of f, as they highlight significant features of the function's behavior.
Recommended video: