Textbook Question
Locating extrema Consider the graph of a function ƒ on the interval [-3, 3]. <IMAGE>
f. On what intervals (approximately) is f concave down?
 Verified step by step guidanceVerified video answer for a similar problem:
 5:53
5:53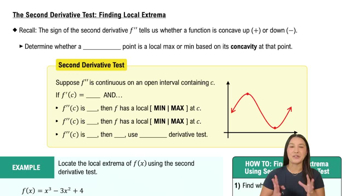 06:02
06:02 5:46
5:46 6:38m
6:38mMaster Determining Concavity from the Graph of f with a bite sized video explanation from Patrick
Start learning