Textbook Question
Infinite Limits
Find the limits in Exercises 37–48. Write ∞ or −∞ where appropriate.
lim x→0 (−1) / (x² (x + 1))
 Verified step by step guidanceVerified video answer for a similar problem:
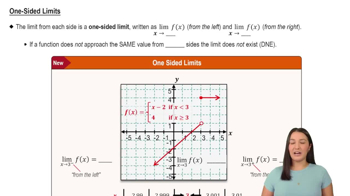
 05:50
05:50 5:53
5:53 05:34
05:34 6:47m
6:47mMaster Finding Limits Numerically and Graphically with a bite sized video explanation from Patrick
Start learning