35. Determine the dimensions of the rectangle of largest area that can be inscribed in the right triangle shown in the accompanying figure.
Table of contents
- 0. Functions7h 55m
- Introduction to Functions18m
- Piecewise Functions10m
- Properties of Functions9m
- Common Functions1h 8m
- Transformations5m
- Combining Functions27m
- Exponent rules32m
- Exponential Functions28m
- Logarithmic Functions24m
- Properties of Logarithms36m
- Exponential & Logarithmic Equations35m
- Introduction to Trigonometric Functions38m
- Graphs of Trigonometric Functions44m
- Trigonometric Identities47m
- Inverse Trigonometric Functions48m
- 1. Limits and Continuity2h 2m
- 2. Intro to Derivatives1h 33m
- 3. Techniques of Differentiation3h 18m
- 4. Applications of Derivatives2h 38m
- 5. Graphical Applications of Derivatives6h 2m
- 6. Derivatives of Inverse, Exponential, & Logarithmic Functions2h 37m
- 7. Antiderivatives & Indefinite Integrals1h 26m
- 8. Definite Integrals4h 44m
- 9. Graphical Applications of Integrals2h 27m
- 10. Physics Applications of Integrals 3h 16m
- 11. Integrals of Inverse, Exponential, & Logarithmic Functions2h 31m
- 12. Techniques of Integration7h 41m
- 13. Intro to Differential Equations2h 55m
- 14. Sequences & Series5h 36m
- 15. Power Series2h 19m
- 16. Parametric Equations & Polar Coordinates7h 58m
5. Graphical Applications of Derivatives
Applied Optimization
Problem 4.5.17b
Textbook Question
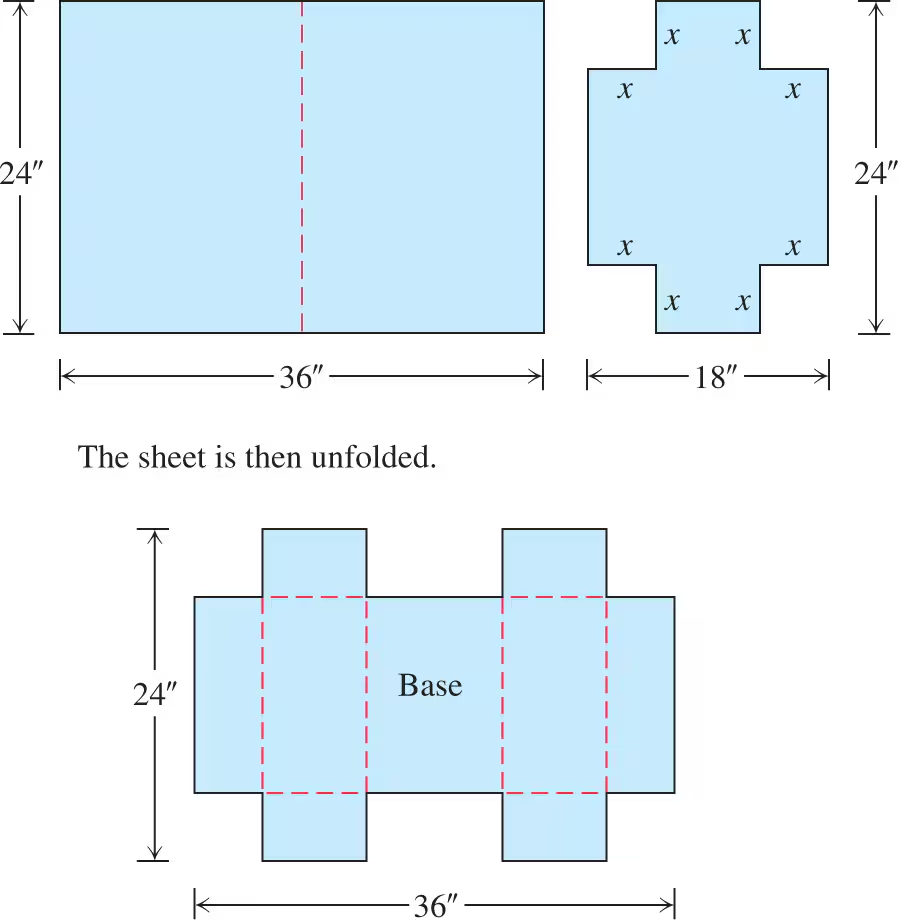
[Technology Exercise] 17. Designing a suitcase A 24-in.-by-36-in. sheet of cardboard is folded in half to form a 24-in.-by-18-in. rectangle as shown in the accompanying figure. Then four congruent squares of side length x are cut from the corners of the folded rectangle. The sheet is unfolded, and the six tabs are folded up to form a box with sides and a lid.

b. Find the domain of V for the problem situation and graph V over this domain.
 Verified step by step guidance
1
Step 1: Understand the problem setup. The cardboard is folded in half to form a rectangle of dimensions 24 inches by 18 inches. Four congruent squares of side length x are cut from the corners of this folded rectangle. When unfolded, the cardboard forms a box with a base and six tabs. The volume of the box depends on the value of x.
Step 2: Write the expression for the dimensions of the box. After cutting squares of side length x, the base dimensions of the box become (24 - 2x) inches by (18 - 2x) inches. The height of the box is x inches, as the tabs are folded up to form the sides.
Step 3: Derive the formula for the volume of the box. The volume V is given by the product of the base area and the height: V = (24 - 2x)(18 - 2x)x. Expand this expression to get the volume in terms of x.
Step 4: Determine the domain of x. Since x represents the side length of the squares cut from the corners, it must satisfy the condition that the dimensions of the base remain positive. This means 24 - 2x > 0 and 18 - 2x > 0. Solve these inequalities to find the range of x values.
Step 5: Graph the volume function V over the domain. Use the derived formula for V and plot it over the valid domain of x. The graph will show how the volume changes as x varies within the domain.
 Verified video answer for a similar problem:
This video solution was recommended by our tutors as helpful for the problem above
Video duration:
4mPlay a video:
0 Comments
Key Concepts
Here are the essential concepts you must grasp in order to answer the question correctly.
Volume of a Box
The volume of a box is calculated using the formula V = length × width × height. In this problem, the dimensions of the box are influenced by the size of the squares cut from the corners, represented by the variable x. Understanding how to express the volume in terms of x is crucial for solving the problem.
Recommended video:

Finding Volume Using Disks
Domain of a Function
The domain of a function refers to the set of all possible input values (x-values) for which the function is defined. In this context, the domain must consider the physical constraints of the problem, such as the size of the cardboard and the requirement that x must be less than half the shorter side of the rectangle to ensure the squares can be cut.
Recommended video:

Finding the Domain and Range of a Graph
Graphing Functions
Graphing a function involves plotting its output values against its input values on a coordinate plane. For this problem, once the volume function V(x) is established, graphing it over the identified domain will visually represent how the volume changes with different sizes of the squares cut from the corners, aiding in understanding the relationship between x and V.
Recommended video:

Graph of Sine and Cosine Function

 1:13m
1:13mWatch next
Master Intro to Applied Optimization: Maximizing Area with a bite sized video explanation from Patrick
Start learningRelated Videos
Related Practice
Textbook Question
