Here are the essential concepts you must grasp in order to answer the question correctly.
Inverse Functions
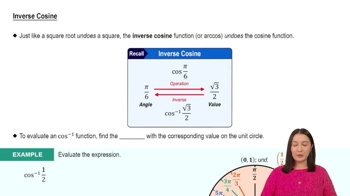
An inverse function essentially reverses the effect of the original function. If a function f takes an input x and produces an output y, the inverse function f⁻¹ takes y as input and returns x. For a function to have an inverse, it must be one-to-one (bijective), meaning it passes the horizontal line test, ensuring that each output corresponds to exactly one input.
Recommended video:
Graphing Functions
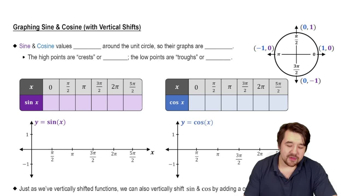
Graphing functions involves plotting points on a coordinate system to visually represent the relationship between the input (x-values) and output (y-values). The graph of a function provides insights into its behavior, such as increasing or decreasing intervals, and can help identify key features like intercepts and asymptotes. When graphing an inverse function, the graph should reflect symmetry about the line y = x.
Recommended video:
Graph of Sine and Cosine Function
Quadratic Functions
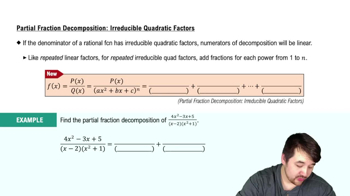
A quadratic function is a polynomial function of degree two, typically expressed in the form f(x) = ax² + bx + c, where a, b, and c are constants and a ≠ 0. The graph of a quadratic function is a parabola, which opens upwards if a > 0 and downwards if a < 0. Understanding the properties of quadratic functions, such as their vertex, axis of symmetry, and direction of opening, is crucial for finding their inverses and analyzing their graphs.
Recommended video:
Partial Fraction Decomposition: Irreducible Quadratic Factors