Join thousands of students who trust us to help them ace their exams!Watch the first video
Multiple Choice
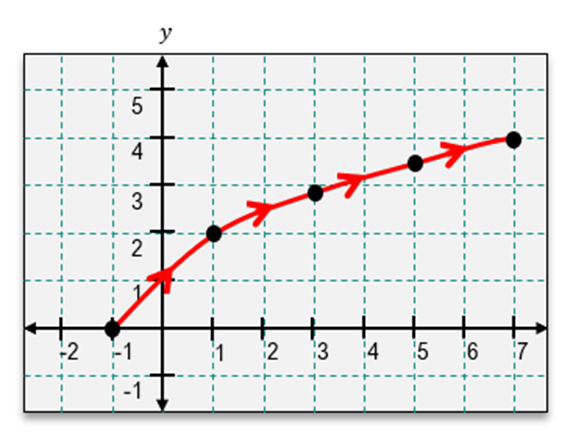
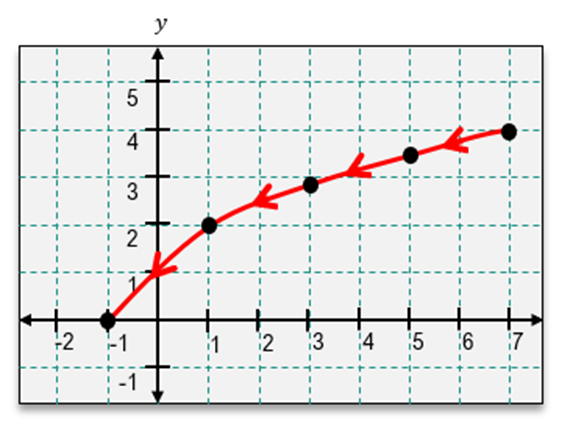
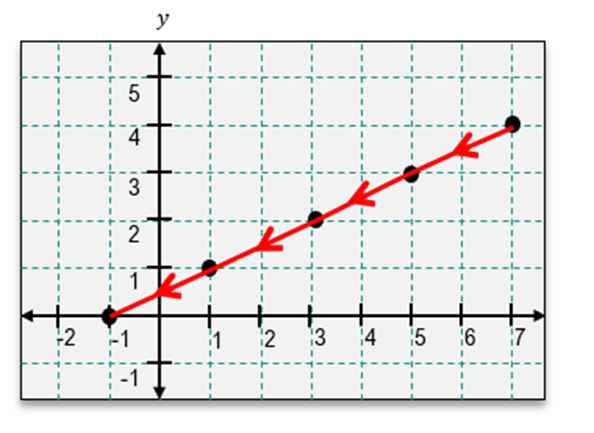
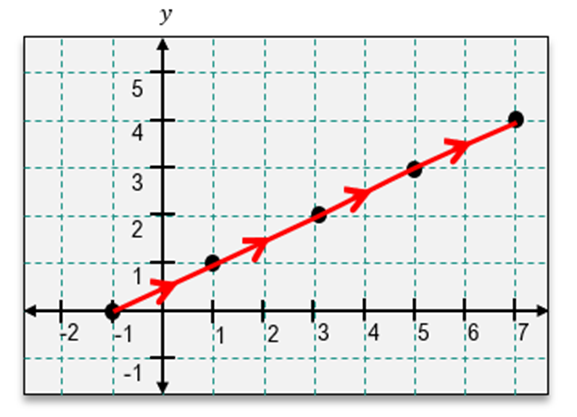
Graph the plane curve formed by the parametric equations and indicate its orientation. x(t)=2t−1; y(t)=2t t≥0
A
B
C
D
0 Comments
Verified step by step guidance
1
Start by understanding the parametric equations given: x(t) = 2t - 1 and y(t) = 2√t, with the condition t ≥ 0.
Determine the range of t values to plot the curve. Since t ≥ 0, you can start with t = 0 and choose several values of t to see how the curve behaves.
Calculate the corresponding x and y values for each chosen t value. For example, when t = 0, x(0) = 2(0) - 1 = -1 and y(0) = 2√0 = 0.
Plot the points (x(t), y(t)) on the graph for each t value. Connect these points smoothly to form the curve.
Indicate the orientation of the curve by drawing arrows along the curve in the direction of increasing t values. This shows the path traced by the curve as t increases.
 Verified step by step guidance
 4:47m
4:47m
