Join thousands of students who trust us to help them ace their exams!Watch the first video
Multiple Choice
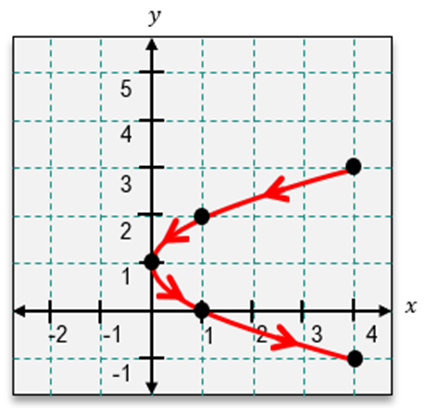
Graph the plane curve formed by the parametric equations and indicate its orientation. x(t)=−t+1; y(t)=t2 −2≤t≤2
A
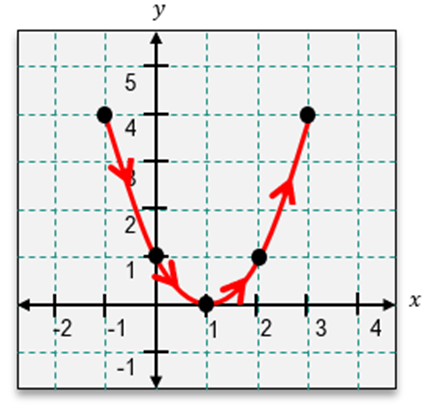
B
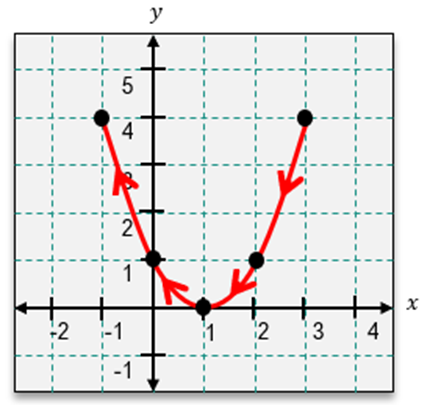
C
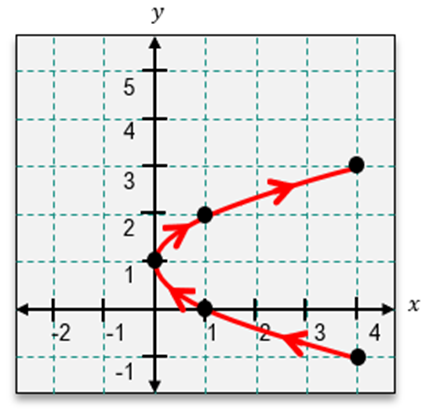
D
0 Comments
Verified step by step guidance
1
Identify the parametric equations: x(t) = -t + 1 and y(t) = t^2.
Determine the range of t, which is -2 ≤ t ≤ 2.
Calculate key points by substituting values of t within the range into the parametric equations. For example, for t = -2, x(-2) = -(-2) + 1 = 3 and y(-2) = (-2)^2 = 4, giving the point (3, 4).
Repeat the calculation for other values of t, such as t = -1, 0, 1, and 2, to find additional points on the curve.
Plot these points on the coordinate plane and connect them smoothly, indicating the direction of the curve by considering the increasing values of t, which will show the orientation of the curve.
 Verified step by step guidance
 4:47m
4:47m
