Consider the reaction: C4H8( g) → 2 C2H4( g) The tabulated data were collected for the concentration of C2H4 as a function of time: a. What is the average rate of the reaction between 0 and 10 s? Between 40 and 50 s?

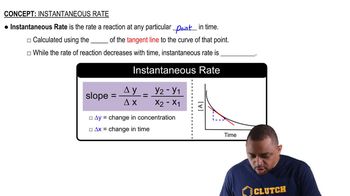
Consider the reaction: H2(g) + Br2(g) → 2 HBr(g). The graph shows the concentration of Br2 as a function of time. a. Use the graph to calculate each quantity: (ii) the instantaneous rate of the reaction at 25 s.
 Verified step by step guidance
Key Concepts
Instantaneous Rate of Reaction

Concentration vs. Time Graph Interpretation

Rate of Reaction and Stoichiometry

Consider the reaction: NO2(g) → NO(g) + 1/2 O2(g) The tabulated data were collected for the concentration of NO2 as a function of time: a. What is the average rate of the reaction between 10 and 20 s? Between 50 and 60 s?
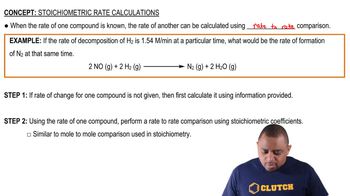
Consider the reaction: NO2(g) → NO(g) + 1/2 O2( g) The tabulated data were collected for the concentration of NO2 as a function of time: b. What is the rate of formation of O2 between 50 and 60 s?
Consider the reaction: H2(g) + Br2(g) → 2 HBr(g) The graph shows the concentration of Br2 as a function of time. a. Use the graph to calculate each quantity: (iii) the instantaneous rate of formation of HBr at 50 s
Consider the reaction: H2(g) + Br2(g) → 2 HBr(g) The graph shows the concentration of Br2 as a function of time.
a. Use the graph to calculate each quantity: (i) the average rate of the reaction between 0 and 25 s
Consider the reaction: H2( g) + Br2( g) → 2 HBr( g) The graph shows the concentration of Br2 as a function of time.
b. Make a rough sketch of a curve representing the concentration of HBr as a function of time. Assume that the initial concentration of HBr is zero
