Energy Diagrams
Energy diagrams visually represent the energy changes during a chemical reaction. They typically plot the energy of the system against the progress of the reaction, illustrating the energy of reactants, products, and any intermediates. Understanding these diagrams helps in analyzing the stability of different species and the overall energy changes involved in the reaction.

 Verified step by step guidance
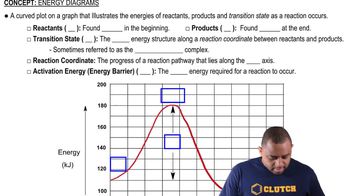
 01:57
01:57