Textbook Question
On the same graph, sketch pH titration curves for the titra-tion of (1) a strong acid with a strong base and (2) a weak acid with a strong base. How do the two curves differ with respect to the following? (a) The initial pH


 Verified step by step guidance


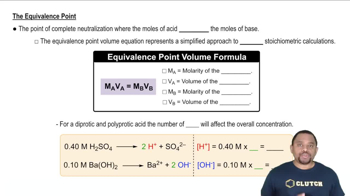
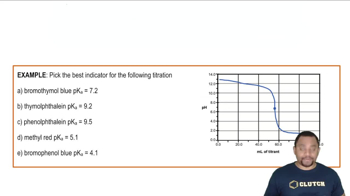
What is the pH at the equivalence point for the titration of 0.10 M solutions of the following acids and bases, and which of the indicators in Figure 17.5 would be suitable for each titration? (c) CH3NH2 (methylamine) and HCl
Consider the titration of 50.0 mL of a 0.100 M solution of the protonated form of the amino acid alanine (H2A+: Ka1 = 4.6 × 10⁻³, Ka2 = 2.0 × 10⁻¹⁰) with 0.100 M NaOH. Calculate the pH after the addition of each of the following volumes of base. (a) 10.0 mL