Textbook Question
From the plot of concentration–time data in Figure 14.1, estimate: (b) the initial rate of decomposition of N2O5.
 Verified step by step guidance
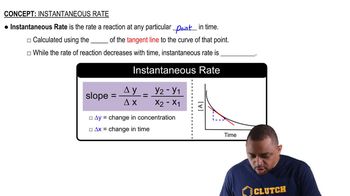
 01:30
01:30 02:03
02:03 02:40
02:40From the plot of concentration–time data in Figure 14.1, estimate: (b) the initial rate of decomposition of N2O5.
Consider a reaction that occurs by the following mechanism:
A + BC → AC + B
AC + D → A + CD
The potential energy profile for this reaction is as follows:
(c) Which of the two steps in the mechanism is the rate-determining step? Write the rate law for the overall reaction.
Consider a reaction that occurs by the following mechanism:
A + BC → AC + B
AC + D → A + CD
The potential energy profile for this reaction is as follows:
(d) Is the reaction endothermic or exothermic? Add labels to the diagram that show the values of the energy of reaction ΔE and the activation energy Ea for the overall reaction.
From the plot of concentration–time data in Figure 14.1, estimate: (a) the instantaneous rate of decomposition of N2O5 at t = 200 s.
From a plot of the concentration–time data in Worked Example 14.9, estimate: (a) the instantaneous rate of decomposition of NO2 at t = 100 s.