Textbook Question
From the plot of concentration–time data in Figure 14.1, estimate: (b) the initial rate of decomposition of N2O5.
 Verified step by step guidance
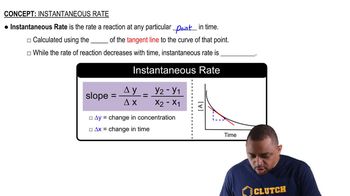
 01:30
01:30 02:16
02:16 01:30
01:30From the plot of concentration–time data in Figure 14.1, estimate: (b) the initial rate of decomposition of N2O5.
Consider a reaction that occurs by the following mechanism:
A + BC → AC + B
AC + D → A + CD
The potential energy profile for this reaction is as follows:
(d) Is the reaction endothermic or exothermic? Add labels to the diagram that show the values of the energy of reaction ΔE and the activation energy Ea for the overall reaction.
From a plot of the concentration–time data in Worked Example 14.9, estimate: (a) the instantaneous rate of decomposition of NO2 at t = 100 s.
From a plot of the concentration–time data in Worked Example 14.9, estimate: (b) the initial rate of decomposition of NO2.