Based on the following reaction profile, how many intermediates are formed in the reaction A¡C? How many transition states are there? Which step, A¡B or B¡C, is the faster? For the reaction A¡C, is ΔE positive, negative, or zero? [Section 14.6]
Ch.14 - Chemical Kinetics

Brown14th EditionChemistry: The Central ScienceISBN: 9780134414232Not the one you use?Change textbook
Chapter 14, Problem 16
Draw a graph showing the reaction pathway for an overall exothermic reaction with two intermediates that are produced at different rates. On your graph, indicate the reactants, products, intermediates, transition states, and activation energies. [Sections 14.6 and 14.7]
 Verified step by step guidance
1
Step 1: Begin by drawing the x-axis and y-axis on your graph. The x-axis will represent the reaction coordinate, which is the progress of the reaction from reactants to products. The y-axis will represent the potential energy of the system.
Step 2: Plot the starting point of the graph at a higher energy level to represent the reactants. Label this point as 'Reactants'.
Step 3: Draw a curve that rises to a peak, representing the first transition state. This peak is the activation energy for the first step of the reaction. Label this peak as 'Transition State 1'.
Step 4: After the first transition state, the curve should drop to a lower energy level than the reactants, indicating the formation of the first intermediate. Label this point as 'Intermediate 1'.
Step 5: Repeat the process for the second intermediate and transition state. Draw another curve rising to a second peak (Transition State 2) and then dropping to a lower energy level than Intermediate 1, indicating the formation of the second intermediate. Finally, the curve should drop further to the lowest energy level, representing the products. Label this final point as 'Products'.
Key Concepts
Here are the essential concepts you must grasp in order to answer the question correctly.
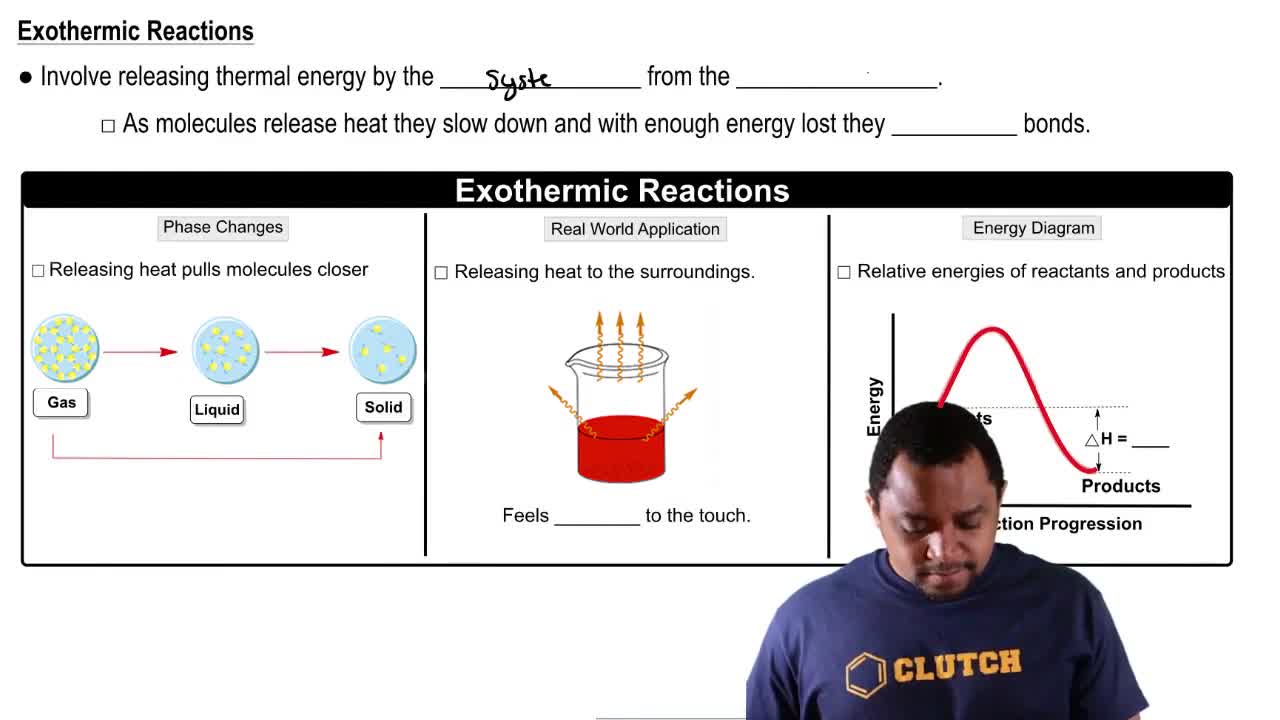
Exothermic Reactions
Exothermic reactions are chemical processes that release energy, usually in the form of heat, to the surroundings. This occurs when the total energy of the products is lower than that of the reactants, resulting in a negative change in enthalpy (ΔH < 0). Understanding this concept is crucial for interpreting the energy changes depicted in reaction pathway graphs.
Recommended video:
Guided course

Endothermic & Exothermic Reactions
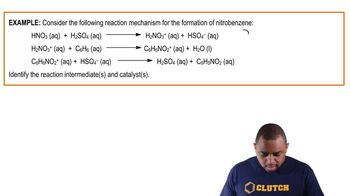
Reaction Intermediates
Reaction intermediates are transient species formed during the conversion of reactants to products. They exist for a limited time and are not present in the final products. In the context of the question, recognizing the role of intermediates is essential for accurately representing their formation and decay on the reaction pathway graph.
Recommended video:
Guided course

Reaction Mechanism Example
Activation Energy and Transition States
Activation energy is the minimum energy required for a reaction to occur, which corresponds to the energy barrier that must be overcome to reach the transition state. The transition state is a high-energy configuration of atoms that occurs during the transformation from reactants to products. Understanding these concepts is vital for illustrating the energy profile of the reaction, including the heights of the activation energy barriers associated with each step.
Recommended video:
Guided course

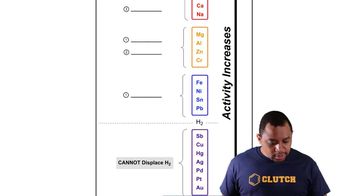
Activity Series Chart
Related Practice
Textbook Question
Textbook Question
The following graph shows two different reaction pathways for the same overall reaction at the same temperature. Is each of the following statements true or false? (b) For both paths, the rate of the reverse reaction is slower than the rate of the forward reaction.
Textbook Question
Consider the diagram that follows, which represents two steps in an overall reaction. The red spheres are oxygen, the blue ones nitrogen, and the green ones fluorine. (d) Write the rate law for the overall reaction if the first step is the slow, rate-determining step. [Section 14.6]
Textbook Question
(b) Name three factors that can affect the rate of a chemical reaction.
Textbook Question
(a) What are the units usually used to express the rates of reactions occurring in solution?
